概述
Go 语言自带的 pprof 是一种性能分析工具,用于帮助开发者分析和优化程序的性能,它可以提供关于 CPU 耗时、内存分配、网络 IO、系统调用、阻塞等待等方面的详细信息。
快速开始
我们来通过一个小例子直观的感受下 pprof 的使用方法,本文所有示例代码运行环境是 go1.20 darwin/arm64。
示例程序
package main

import (
	"bytes"
	"log"
	"math/rand"
	"net/http"
	_ "net/http/pprof" // 开启 pprof
	"time"
)

// 换成一个随机字符串并返回对应的缓冲区
func genRandomBytes() *bytes.Buffer {
	var buff bytes.Buffer
	for i := 1; i < 10000; i++ {
		buff.Write([]byte{'0' + byte(rand.Intn(10))})
	}
	return &buff
}

func main() {
	go func() {
		for {
			// 循环调用生成字符串方法,模拟 CPU 负载
			for i := 0; i < 1000; i++ {
				_ = genRandomBytes()
			}
			time.Sleep(time.Second)
		}
	}()

	// 程序绑定到 6060 端口
	// pprof 结果也必须通过该接口获取
	log.Fatal(http.ListenAndServe("127.0.0.1:6060", nil))
}
package main
import (
"bytes"
"log"
"math/rand"
"net/http"
_ "net/http/pprof" // 开启 pprof
"time"
)
// 换成一个随机字符串并返回对应的缓冲区
func genRandomBytes() *bytes.Buffer {
var buff bytes.Buffer
for i := 1; i < 10000; i++ {
buff.Write([]byte{'0' + byte(rand.Intn(10))})
}
return &buff
}
func main() {
go func() {
for {
// 循环调用生成字符串方法,模拟 CPU 负载
for i := 0; i < 1000; i++ {
_ = genRandomBytes()
}
time.Sleep(time.Second)
}
}()
// 程序绑定到 6060 端口
// pprof 结果也必须通过该接口获取
log.Fatal(http.ListenAndServe("127.0.0.1:6060", nil))
}查看程序 pprof 结果
1. 启动程序
$ go build main.go && ./main$ go build main.go && ./main2. 浏览器访问
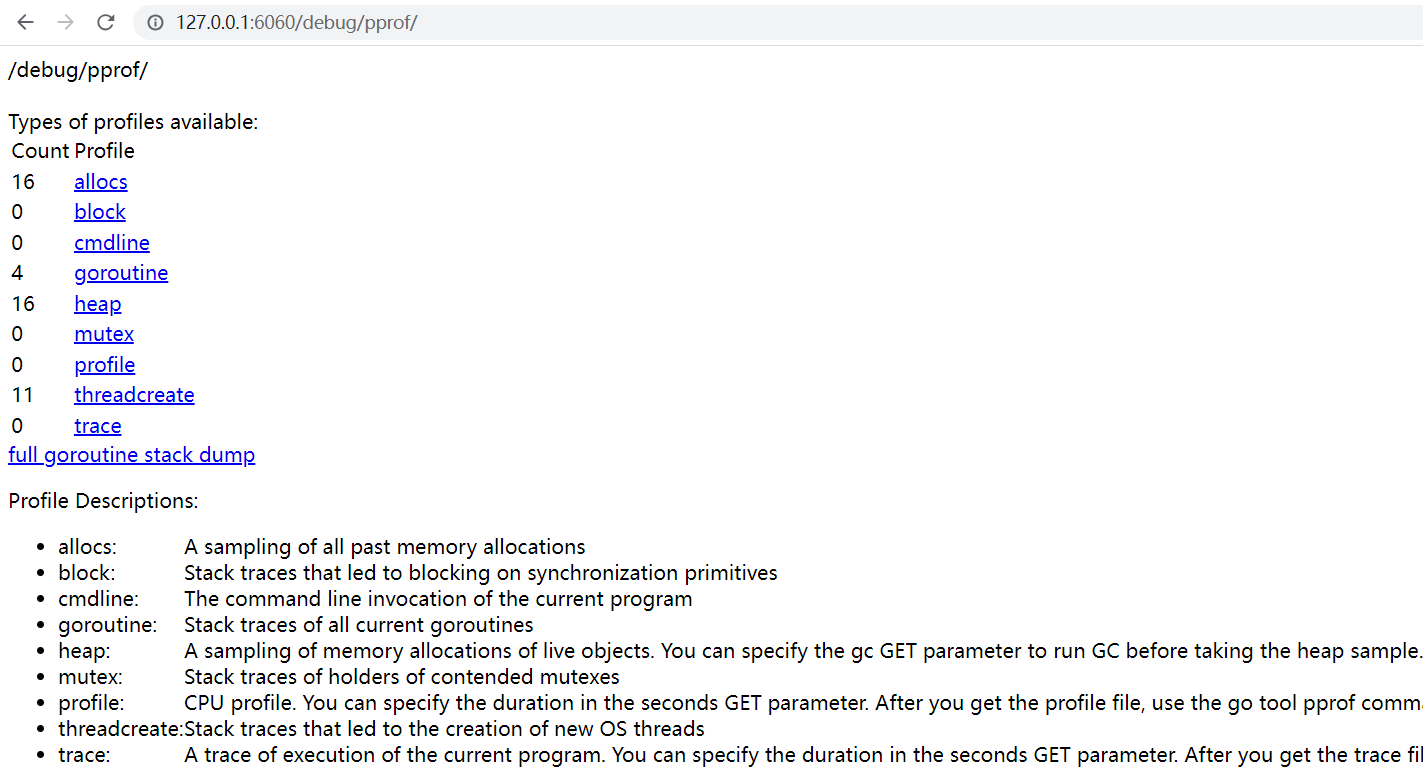
通过浏览器打开下面的链接,可以看到 pprof 的实时采样数据。
http://127.0.0.1:6060/debug/pprof/http://127.0.0.1:6060/debug/pprof/正常情况下,我们可以看到如下页面:
3. 获取某个指标的采样数据
例如我们想要拿到 CPU 的采样数据,可以点击图中的 profile 链接,此时会进入默认的 30 秒采样阶段 (浏览器表现为不停转圈),30 秒之后,浏览器会弹出下载窗口, 提示你是否要保存名称为 profile 的采样文件。
这里我们通过 CURL 的方式来直接下载,读者可以利用等待 CURL 的时间大致了解一下页面上的几个采样类型。
# 下载 CPU 样本数据,并保存到 cpu.pprof 文件中

$ curl -sS "http://127.0.0.1:6060/debug/pprof/profile?seconds=30" -o cpu.pprof
# 下载 CPU 样本数据,并保存到 cpu.pprof 文件中
$ curl -sS "http://127.0.0.1:6060/debug/pprof/profile?seconds=30" -o cpu.pprof4. 分析采样数据
Go 语言自带的命令行工具集中的 go tool pprof 可以对样本数据进行分析。
# 对 cpu.pprof 文件进行分析

$ go tool pprof main cpu.pprof
# 对 cpu.pprof 文件进行分析
$ go tool pprof main cpu.pprof输入上述命令后,进入 pprof 的专用命令行中:
...
Entering interactive mode (type "help" for commands, "o" for options)
(pprof) 等待用户输入
...
Entering interactive mode (type "help" for commands, "o" for options)
(pprof) 等待用户输入5. 命令行工具操作方法
此时我们可以输入 help, 看一下相关的操作提示 (Tips: 我们无需死记硬背命令行参数,使用 pprof 的时候输入 help 寻找对应的参数即可):
# 输入 top 后,命令行输出结果如下

  Commands:
    ...

    top              Outputs top entries in text form
    topproto         Outputs top entries in compressed protobuf format
    traces           Outputs all profile samples in text form
    tree             Outputs a text rendering of call graph
    web              Visualize graph through web browser

    ...

  Options:

...
# 输入 top 后,命令行输出结果如下
Commands:
...
top Outputs top entries in text form
topproto Outputs top entries in compressed protobuf format
traces Outputs all profile samples in text form
tree Outputs a text rendering of call graph
web Visualize graph through web browser
...
Options:
...这里以 top 参数为例,输出采样数据 CPU 使用 top 5 的调用:
(pprof) top 5

# 输出结果如下

Showing nodes accounting for 4090ms, 75.74% of 5400ms total
Dropped 56 nodes (cum <= 27ms)
Showing top 5 nodes out of 53
      flat  flat%   sum%        cum   cum%
    1290ms 23.89% 23.89%     2920ms 54.07%  math/rand.(*lockedSource).Int63
    1260ms 23.33% 47.22%     1260ms 23.33%  sync.(*Mutex).Unlock (inline)
     740ms 13.70% 60.93%     3710ms 68.70%  math/rand.(*Rand).Int31n
     490ms  9.07% 70.00%      870ms 16.11%  bytes.(*Buffer).Write
310ms 5.74% 75.74% 310ms 5.74% math/rand.(*rngSource).Uint64 (inline)(pprof) top 5
# 输出结果如下
Showing nodes accounting for 4090ms, 75.74% of 5400ms total
Dropped 56 nodes (cum <= 27ms)
Showing top 5 nodes out of 53
flat flat% sum% cum cum%
1290ms 23.89% 23.89% 2920ms 54.07% math/rand.(*lockedSource).Int63
1260ms 23.33% 47.22% 1260ms 23.33% sync.(*Mutex).Unlock (inline)
740ms 13.70% 60.93% 3710ms 68.70% math/rand.(*Rand).Int31n
490ms 9.07% 70.00% 870ms 16.11% bytes.(*Buffer).Write
310ms 5.74% 75.74% 310ms 5.74% math/rand.(*rngSource).Uint64 (inline)通过上面的输出结果,可以很清晰地看到消耗最多 CPU 资源的 5 个调用方法。
这里需要注意的是第三列的 sum% 的字段,表示的是前 N 行的 flat% 列的数值总和,例如第三行的的 60.93% 就表示:
第一行 + 第二行 + 第三行 = 23.89% + 23.33% + 13.70% = 60.93%
# 通过 cum 列排序
(pprof) top 5 -cum

...
# 通过 cum 列排序
(pprof) top 5 -cum
...列属性
下面对每列表示的数据做一个简单的概述:
- flat: 表示函数自身的 CPU 使用时间,单位为纳秒
- flat%:表示函数自身的 CPU 使用时间占总时间的百分比
- sum%: 表示函数及其内部调用的其他函数的 CPU 使用时间占总时间的百分比
- cum: 表示函数及其内部调用的其他函数的 CPU 使用时间之和,单位为纳秒
- cum%: 表示函数及其内部调用的其他函数的 CPU 使用时间之和占总时间的百分比
flat 和 cum 的区别在于: flat 只统计函数自身的 CPU 使用时间,不包括调用其他函数的时间,而 cum 则包括了函数自身的时间和调用其他函数的时间。
其他用法
刚才的示例过程是先使用 CURL 下载采样数据,然后使用 pprof 命令工具进行分析,可以将这两个步骤合并到一个步骤中。
$ go tool pprof "http://127.0.0.1:6060/debug/pprof/profile?seconds=30"$ go tool pprof "http://127.0.0.1:6060/debug/pprof/profile?seconds=30"上述命令会在采样结果保存完成后,自动进入 pprof 的专用命令行中。
采样数据列表
| 采样类型 | 描述 |
|---|---|
| allocs | 内存总分配 |
| block | 同步原语导致的阻塞 |
| cmdline | 进程启动命令行 |
| goroutine | 当前所有的 goroutine |
| heap | 内存分析 |
| mutex | 互斥锁 |
| profile | CPU |
| threadcreate | 操作系统中的线程创建 |
| trace | 程序执行 trace, 和其他样本数据不同的是,这个需要使用 go tool trace 来分析 |
| full goroutine stack dump | 打印所有 goroutine 的堆栈 |
主要参数
- seconds: 设置采样时间,单位秒
- debug:
- 0: 采样函数地址列表,需要利用 pprof 才能还原
- 1: 将函数地址转换为函数名,可以在浏览器中直接查看
- 2: 除了函数地址外,还有对应的调用堆栈,同样可以在浏览器中直接查看
内存分析字段说明
通过浏览器直接访问 http://127.0.0.1:6060/debug/pprof/heap?debug=1, 然后加载页面底部,可以看到内存相关的数据,我们选择一些常用的指标进行说明。
# 示例内存分析数据
# 对应的标准库中的对象为 runtime.MemStats{}

# runtime.MemStats
# Alloc = 1382056
# TotalAlloc = 2855089694704
# Sys = 19334408
# Lookups = 0
# Mallocs = 871957108
# Frees = 871955873
# HeapAlloc = 1382056
# HeapSys = 11993088
# HeapIdle = 9977856
# HeapInuse = 2015232
# HeapReleased = 7012352
# HeapObjects = 1235
# Stack = 589824 / 589824
...
# 示例内存分析数据
# 对应的标准库中的对象为 runtime.MemStats{}
# runtime.MemStats
# Alloc = 1382056
# TotalAlloc = 2855089694704
# Sys = 19334408
# Lookups = 0
# Mallocs = 871957108
# Frees = 871955873
# HeapAlloc = 1382056
# HeapSys = 11993088
# HeapIdle = 9977856
# HeapInuse = 2015232
# HeapReleased = 7012352
# HeapObjects = 1235
# Stack = 589824 / 589824
...| 字段名称 | 描述 |
|---|---|
| TotalAlloc | 进程启动后累计分配总内存 |
| Sys | 从操作系统申请的总内存 |
| Frees | 累计释放的堆内存 |
| HeapAlloc | 当前正在使用的内存 + 未被 GC 释放的内存 |
| HeapSys | 从操作系统申请的堆内存 |
| HeapIdle | 空闲内存,可以被申请甚至作为栈使用 |
| HeapInuse | 当前正在使用的堆内存 |
| HeapReleased | 已经归还给操作系统的堆内存 |
| Sys | 从操作系统申请的总内存 |
| StackSys | StackInuse + 直接从操作系统申请的内存 |
| StackInuse | 当前正在使用的栈内存 |
内存关键指标
- inuse_objects: 内存中留存的对象数量
- inuse_space: 程序实际占用内存
- alloc_objects: 内存中分配的对象数量 (如果该指标明显大于 inuse_objects 指标,说明存在内存分配尖峰)
- alloc_space: 程序分配内存 (如果该指标明显大于 inuse_space 指标,说明存在内存分配尖峰)
排查内存相关问题时,除了关注内存使用和闲置相关参数外,还要关注 GC 频率、GC 时间等参数。
读者可以在 pprof 页面上点击不同的链接来查看不同的采样数据,需要注意的是: profile 和 trace 两个指标默认的采样时间是 30 秒,其他指标都是即时的 (每次刷新显示不同的数据)。
graphiv
pprof 可以生成样本数据分析图 (如 CPU 火焰图) 达到更好的可观测性,但是生成的图需要使用 graphiv 进行渲染,如果要运行 pprof 的机器还未安装 graphviz, 可以参考 官网的安装教程 进行安装。
启动 Web UI
虽然 pprof 提供的命令行操作方式已经非常方便,但是如果我们希望使用更加直观的 UI 方式来展现采样分析结果,可以使用 Web UI 功能。 Web UI 提供了和 pprof 命令行同样的功能,但是可观测性更强。
1. 通过 -http 参数
$ go tool pprof -http=127.0.0.1:6061 "http://127.0.0.1:6060/debug/pprof/profile?seconds=30"

# 输出如下
Fetching profile over HTTP from http://127.0.0.1:6060/debug/pprof/profile?seconds=30
Saved profile in /home/stars/pprof/pprof.main.samples.cpu.004.pb.gz
Serving web UI on http://127.0.0.1:6061
...
$ go tool pprof -http=127.0.0.1:6061 "http://127.0.0.1:6060/debug/pprof/profile?seconds=30"
# 输出如下
Fetching profile over HTTP from http://127.0.0.1:6060/debug/pprof/profile?seconds=30
Saved profile in /home/stars/pprof/pprof.main.samples.cpu.004.pb.gz
Serving web UI on http://127.0.0.1:6061
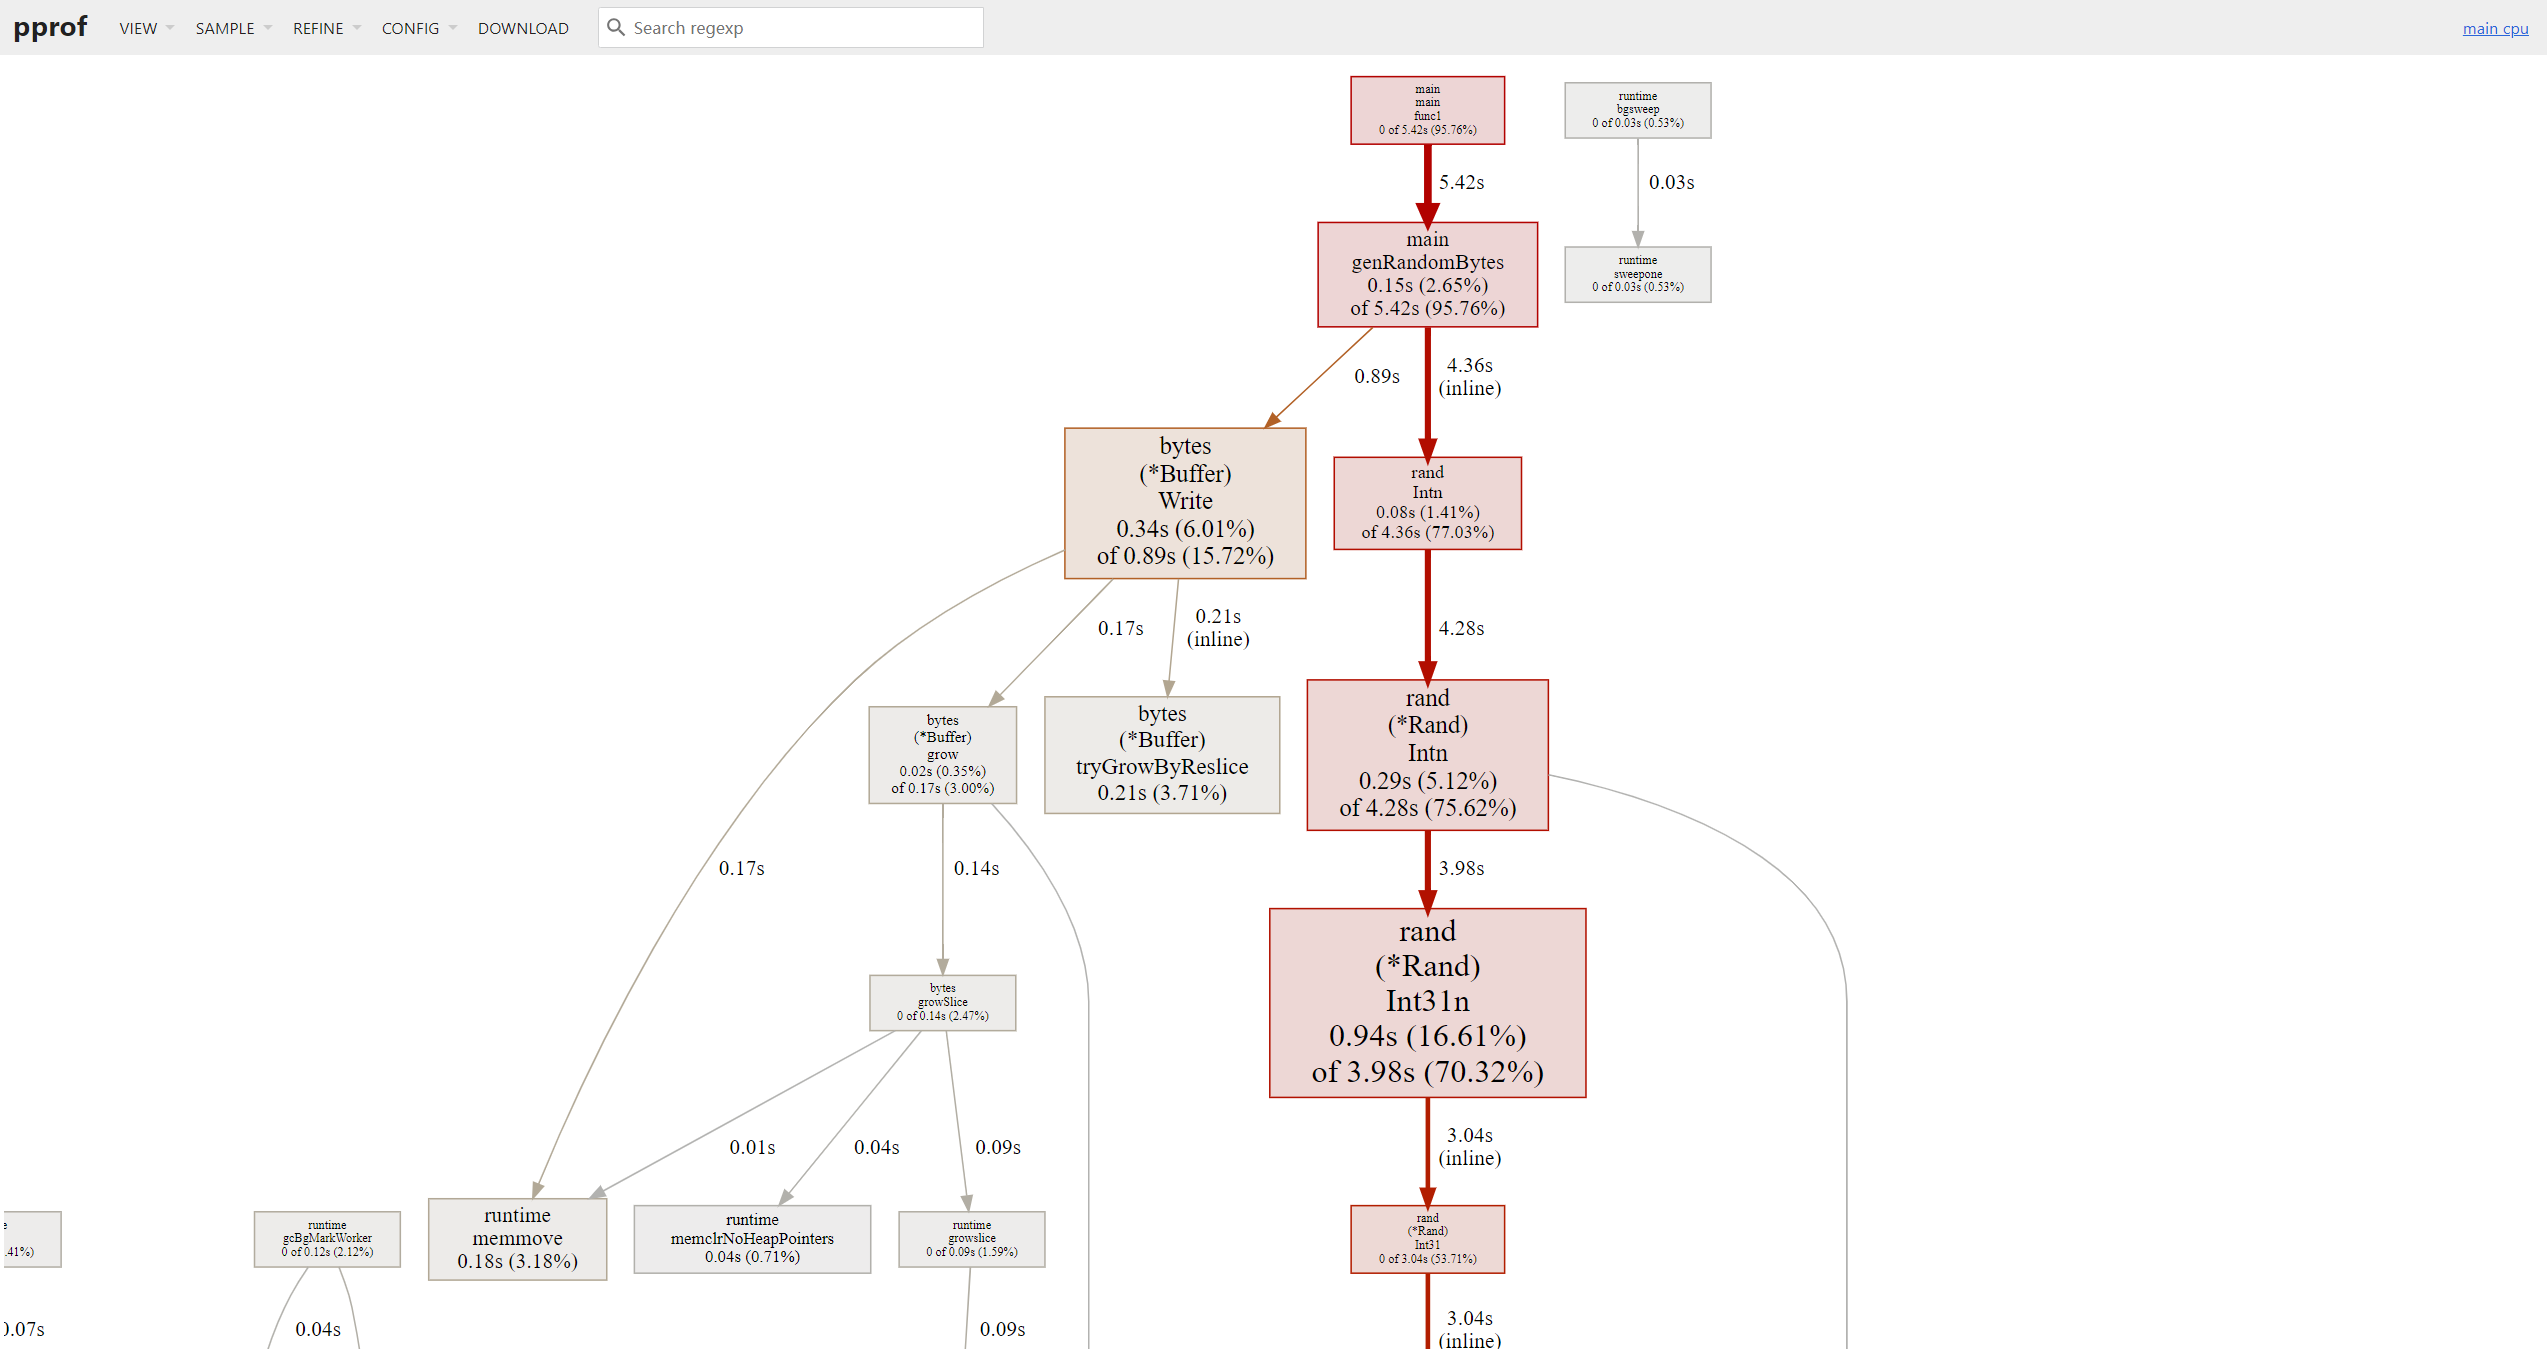
...上述命令会在采样结果保存完成后,新启动一个 Web Server (端口为 6061),自动打开浏览器并跳转到 http://127.0.0.1:6061/ui/。
2. 通过 web 参数
输入 go tool pprof main cpu.pprof 进入到 pprof 的专用命令行中,然后输入参数 web。
Entering interactive mode (type "help" for commands, "o" for options)
(pprof) web

# 输出如下
...
+ Start "/tmp/pprof001.svg"
...
Entering interactive mode (type "help" for commands, "o" for options)
(pprof) web
# 输出如下
...
+ Start "/tmp/pprof001.svg"
...上述命令会生成一个 SVG 文件,然后自动在浏览器打开,但是打开的页面中只有一个图片,没有其他功能 (所以后文中都采用刚才的第一种方法作为 Web UI 打开方式)。
Web UI 功能概览
针对单个采样结果的分析,Web UI 提供了非常强大的功能,下面通过示例图来演示。
所有的功能菜单都在导航栏,直接选择对应的数据即可。

top 函数
功能和 pprof 命令行中的 top 一样,显示采样 top N 的数据:

火焰图
基于 Brendan Gregg 大佬发明的火焰图,根据图中的颜色深浅,调用链形状的长短,几乎可以瞬间定位到出现问题的方法。
功能和 pprof 命令行中的 top 一样,显示采样 top N 的数据:

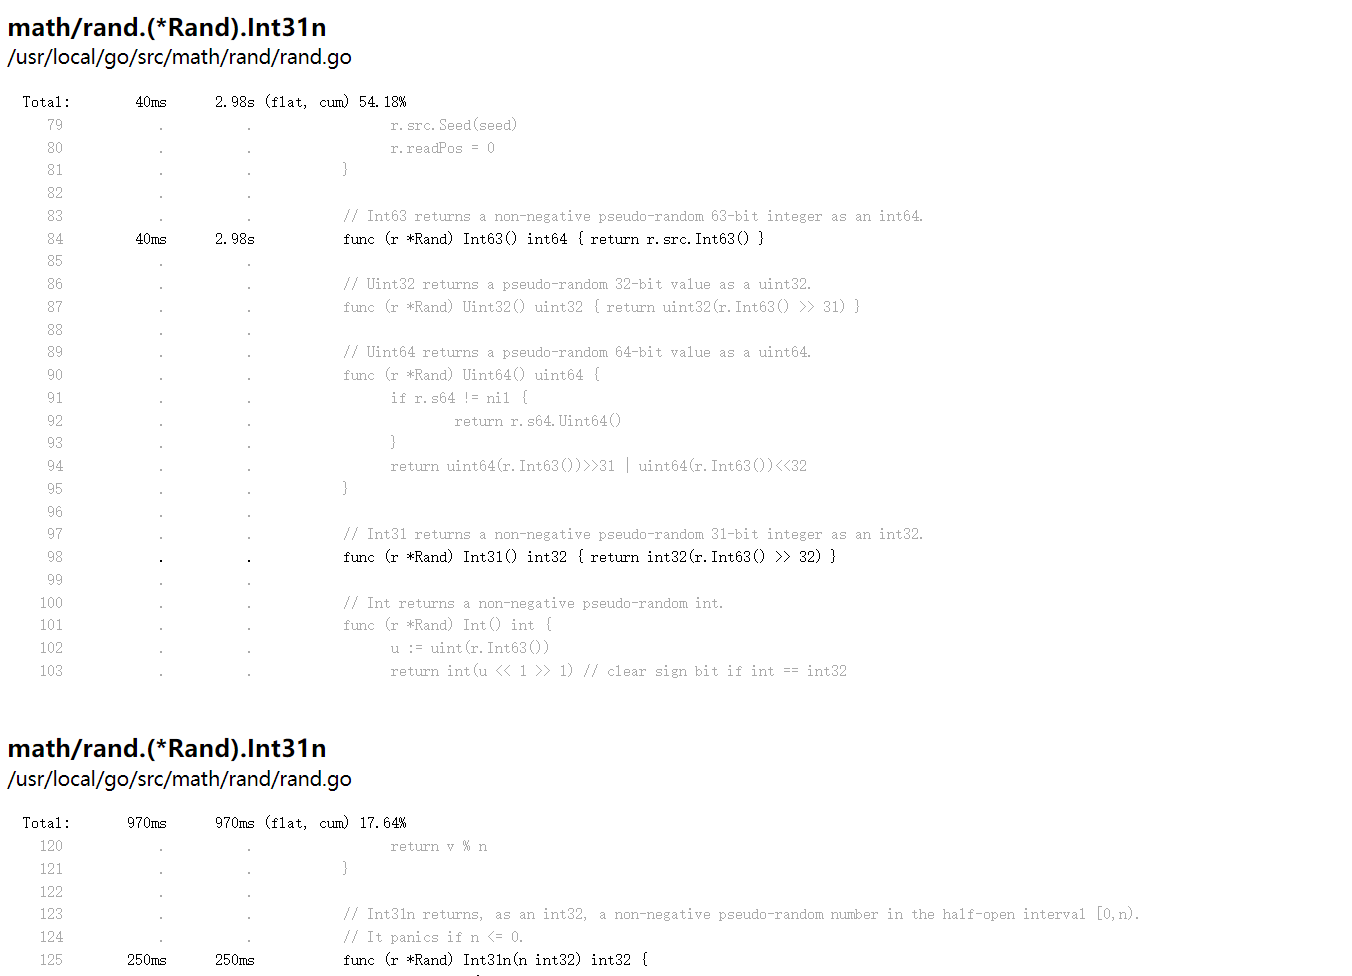
peek
可以看到采样分析数据和对应的代码。

source
可以看到采样分析数据和对应的代码函数相关信息。
其他菜单
限于篇幅,其他菜单功能这里就不一一展示了,读者可以在 Web UI 页面自行研究。
trace 采样
写到这里,pprof 数据采样分析差不多就介绍完了,然后这里再简单介绍一下 trace 数据采样分析,两者的区别在于:
- pprof : 是一种基于时间的采样方法,周期性地暂停程序并记录当前函数调用堆栈信息,以及每个函数调用的执行时间,这种采样方法可以提供关于函数调用频率和执行时间的统计信息,从而帮助分析程序的性能瓶颈
- trace : 是一种基于事件的采样方法,在程序运行过程中,trace 会记录特定事件(如函数调用、系统调用等)发生的详细信息,包括事件发生的时间戳、相关的上下文信息等。通过分析这些事件信息,可以了解程序的执行路径、并发情况、阻塞等待等问题
和基于毫秒频率的 pprof 定时数据采样相比,基于事件的 trace 精确到了纳秒,因此对系统的性能影响还是非常大的。 一般情况下不需要使用 trace 来定位性能问题,除非是需要获取运行时的程序数据,例如 goroutine 调度、阻塞、GC 等。
采样命令参数
可以直接将路径中的 path 参数指定为 trace, 即可开始 trace 采样。
# trace 采样数据,时间 30 秒
$ curl -sS "http://127.0.0.1:6060/debug/pprof/trace?seconds=30" -o trace.out
# trace 采样数据,时间 30 秒
$ curl -sS "http://127.0.0.1:6060/debug/pprof/trace?seconds=30" -o trace.out采样数据完成后,可以通过 go tool trace 命令打开采样文件:
$ go tool trace trace.out

# 输入如下:

2023/07/29 11:44:53 Parsing trace...
2023/07/29 11:44:53 Splitting trace...
2023/07/29 11:44:53 Opening browser. Trace viewer is listening on http://127.0.0.1:64552
$ go tool trace trace.out
# 输入如下:
2023/07/29 11:44:53 Parsing trace...
2023/07/29 11:44:53 Splitting trace...
2023/07/29 11:44:53 Opening browser. Trace viewer is listening on http://127.0.0.1:64552输入上述命令之后,会启动一个 Web Server (端口号随机), 并且自动在浏览器中打开页面:

trace Web UI
trace Web UI 和 pprof Web UI 提供的功能类似,只不过各功能点的链接分散在了页面中,而不是集中到顶部的导航区域。
点击页面的 View trace 链接,可以显示 goroutine、内存分析、操作系统线程调用的相关信息。
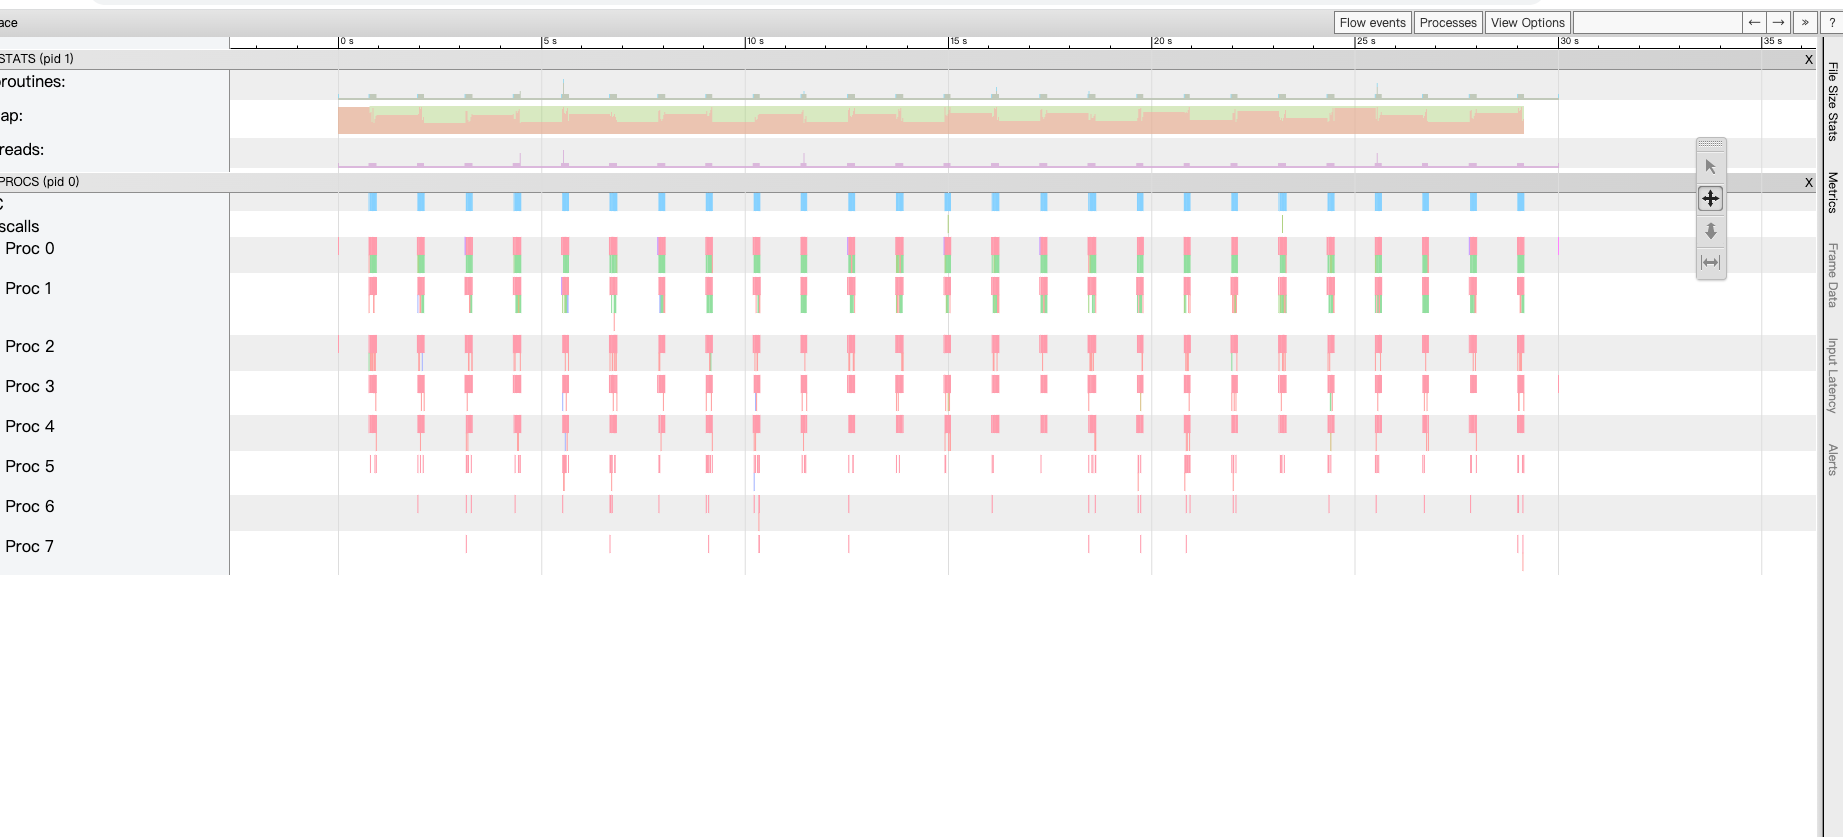
输入 shift + / 组合键,可以弹出 “使用帮助” 窗口:
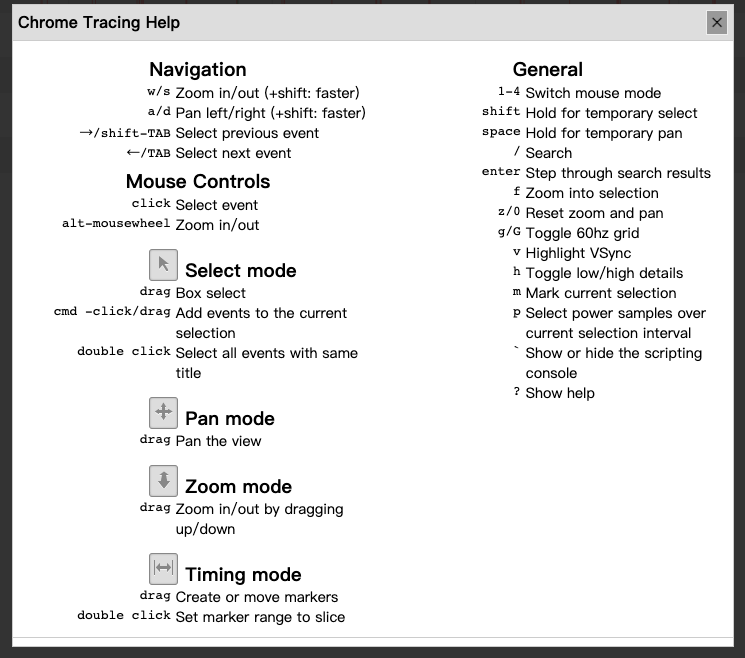
例如我们可以按 w 键缩小时间单位粒度,按 s 键放大时间单位粒度。
点击页面的 Goroutine analysis 链接,可以显示每个 goroutine 的编号、调用时长、GMP 调度、网络 IO、阻塞、GC 等方面的数据。
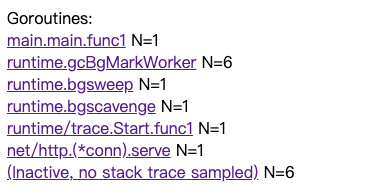
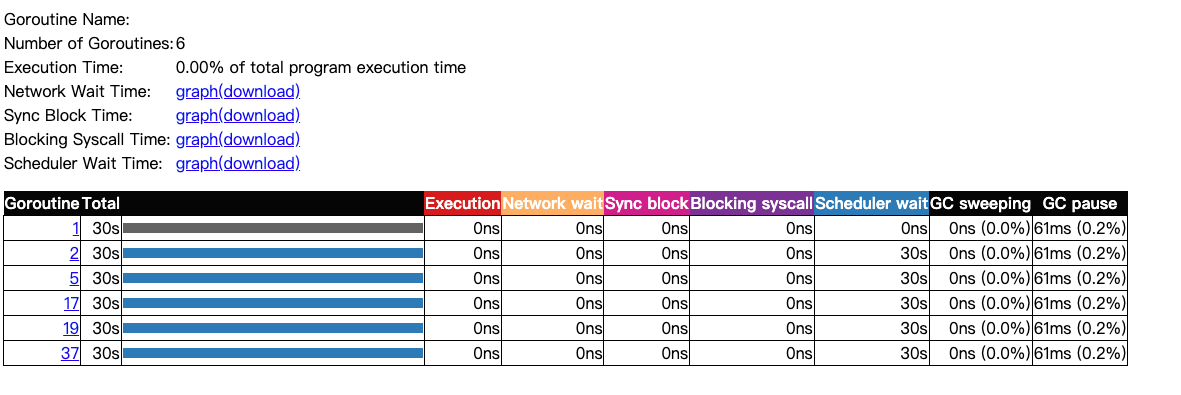
点击 Profiles 区域的链接,可以查看程序的网络 IO、同步、系统调用、GMP 调度等方面的数据。

限于篇幅,页面中其他链接功能这里就不一一展示了,读者可以在 Web UI 页面自行研究。
比较优化前和优化后
我们可以在优化代码之前先生成一个 pprof 采样文件,在完成代码优化之后再生成一个 pprof 采样文件,通过比较两者的差异结果来证明我们的优化工作是否有效。 需要注意的是,优化前后必须使用相同的运行环境,保证采样数据的可比性。
# 优化前采样
$ curl -sS "http://127.0.0.1:6060/debug/pprof/profile?seconds=30" -o cpu_before.pprof

# 优化后采样
$ curl -sS "http://127.0.0.1:6060/debug/pprof/profile?seconds=30" -o cpu_after.pprof

# 比较差异 (Web UI)
$ go tool pprof -http=127.0.0.1:6062 --base cpu_before.pprof cpu_after.pprof
# 优化前采样
$ curl -sS "http://127.0.0.1:6060/debug/pprof/profile?seconds=30" -o cpu_before.pprof
# 优化后采样
$ curl -sS "http://127.0.0.1:6060/debug/pprof/profile?seconds=30" -o cpu_after.pprof
# 比较差异 (Web UI)
$ go tool pprof -http=127.0.0.1:6062 --base cpu_before.pprof cpu_after.pprof上述命令会新启动一个 Web Server (端口为 6062),自动打开浏览器并跳转到 http://127.0.0.1:6062/ui/, 通过 UI 我们可以很直观地看到两个采样数据的差异。
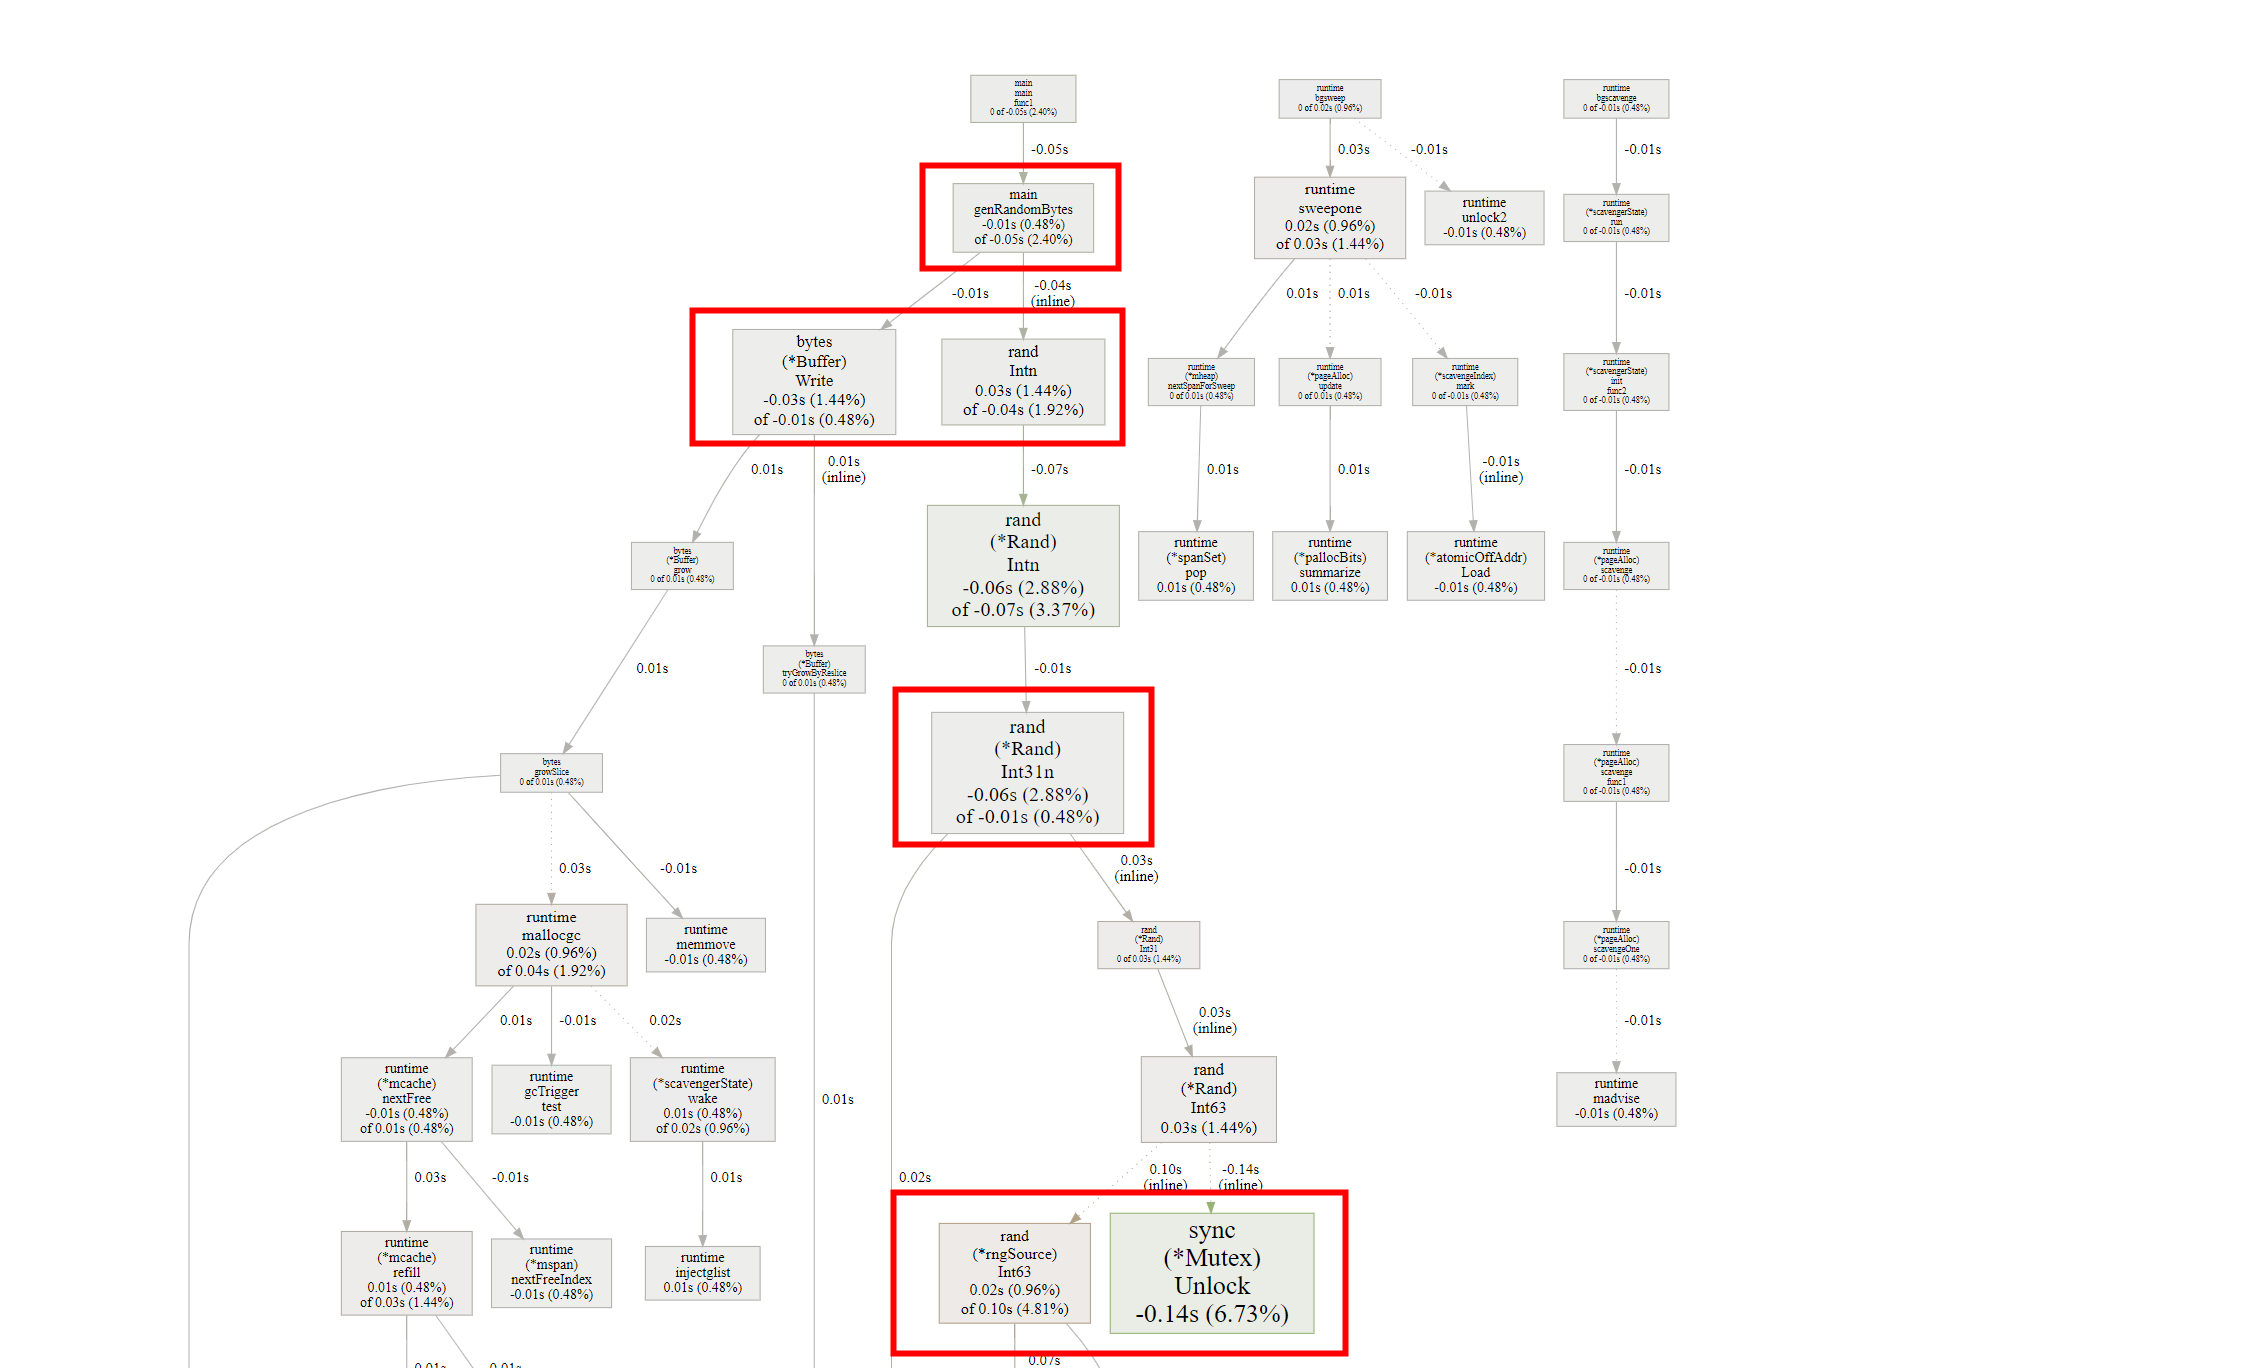
非 Web 服务使用 pprof
在非 Web 服务中 (如后台服务) 使用 pprof 时,可以使用标准库中的 runtime/pprof 包, 前文示例中的 net/http/pprof 包本质也是对 runtime/pprof 包的一层 Web 封装。
示例代码
package main

import (
	"log"
	"math/rand"
	"os"
	"runtime/pprof"
	"sort"
)

func main() {
	// 设置采样数据保存文件
	file := "/tmp/runtime_cpu.pprof"
	f, _ := os.OpenFile(file, os.O_CREATE|os.O_RDWR, 0644)

	defer func() {
		err := f.Close()
		if err != nil {
			log.Fatalln(err)
		}
	}()

	// 开始 CPU 采样
	err := pprof.StartCPUProfile(f)
	if err != nil {
		panic(err)
	}
	defer pprof.StopCPUProfile()

	// 每次生成 10000 个随机数字进行排序
	for i := 0; i < 1024; i++ {
		nums := genRandomNumbers(10000)
		sort.Slice(nums, func(i, j int) bool {
			return nums[i] < nums[j]
		})
	}
}

// 生成随机数切片
func genRandomNumbers(n int) []int {
	nums := make([]int, n)
	for i := 1; i < n; i++ {
		nums[i] = rand.Int()
	}
	return nums
}
package main
import (
"log"
"math/rand"
"os"
"runtime/pprof"
"sort"
)
func main() {
// 设置采样数据保存文件
file := "/tmp/runtime_cpu.pprof"
f, _ := os.OpenFile(file, os.O_CREATE|os.O_RDWR, 0644)
defer func() {
err := f.Close()
if err != nil {
log.Fatalln(err)
}
}()
// 开始 CPU 采样
err := pprof.StartCPUProfile(f)
if err != nil {
panic(err)
}
defer pprof.StopCPUProfile()
// 每次生成 10000 个随机数字进行排序
for i := 0; i < 1024; i++ {
nums := genRandomNumbers(10000)
sort.Slice(nums, func(i, j int) bool {
return nums[i] < nums[j]
})
}
}
// 生成随机数切片
func genRandomNumbers(n int) []int {
nums := make([]int, n)
for i := 1; i < n; i++ {
nums[i] = rand.Int()
}
return nums
}直接运行:
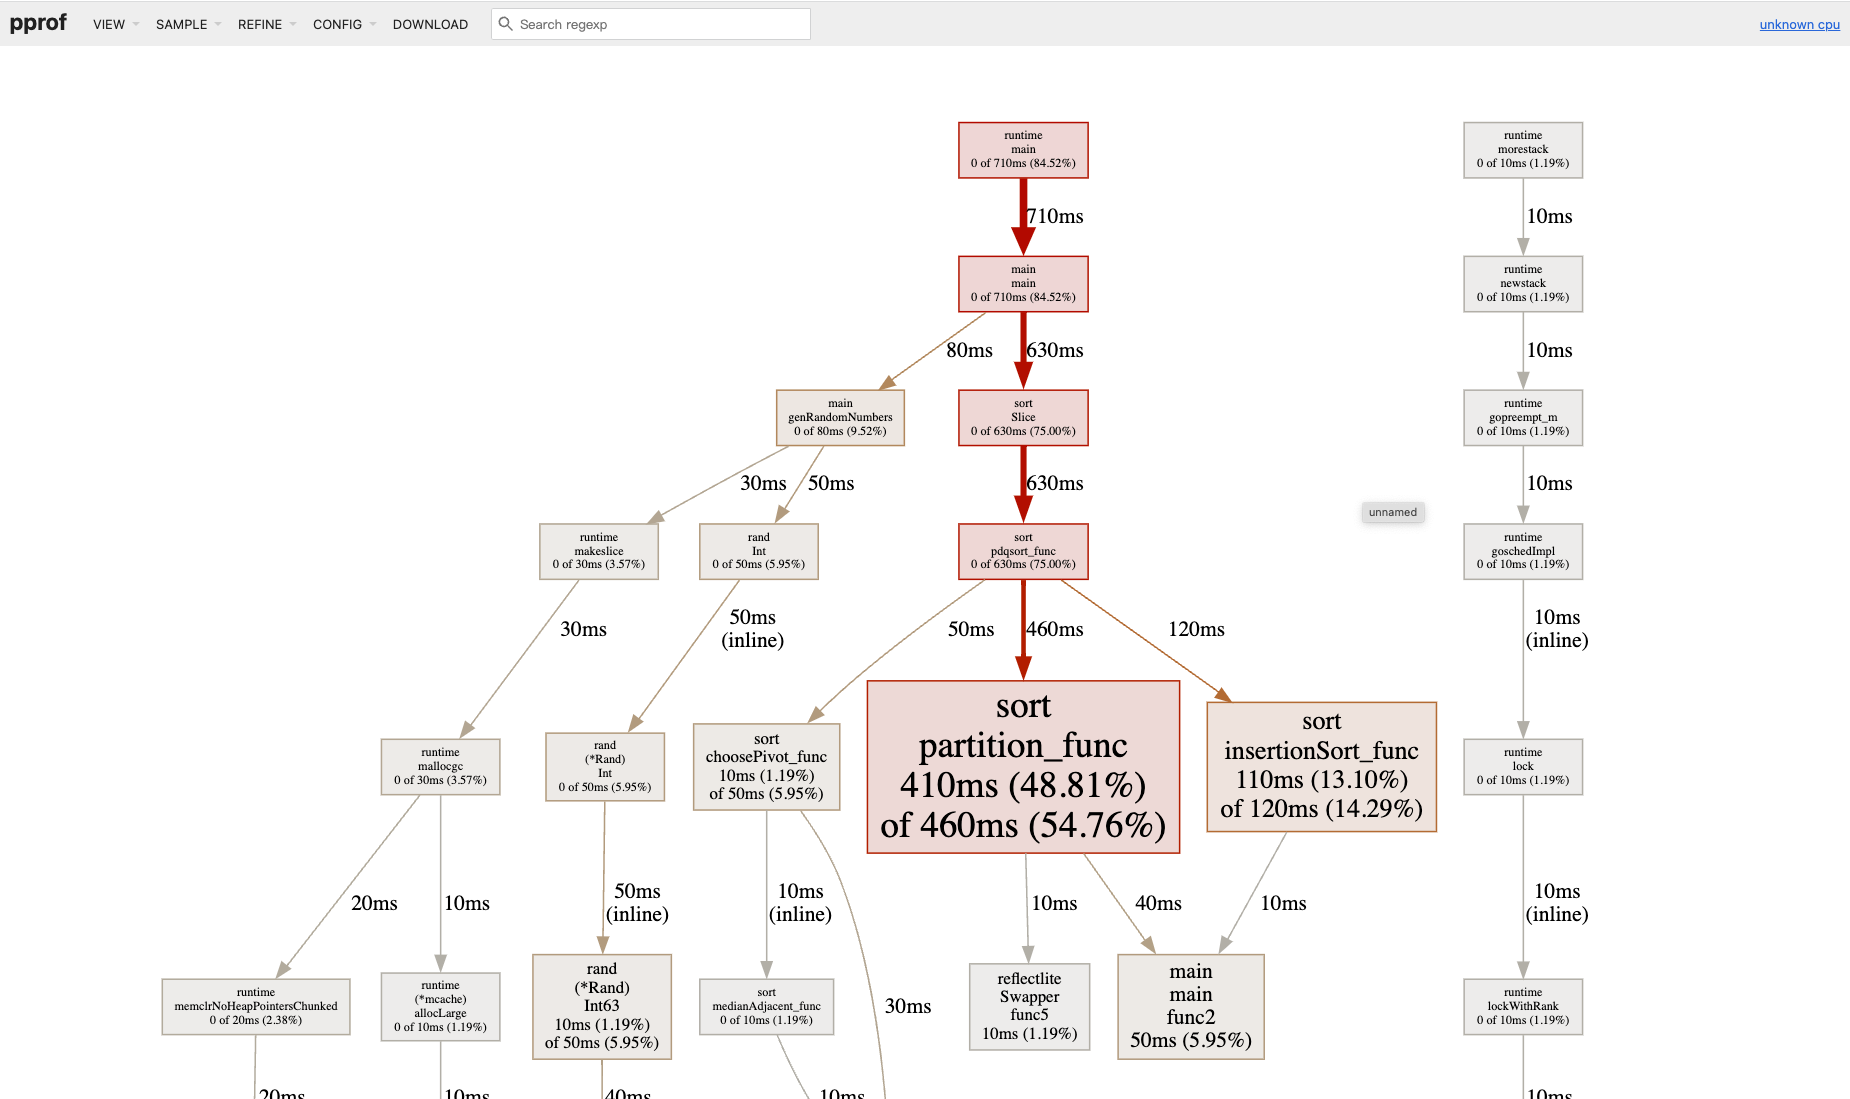
$ go run main.go$ go run main.go程序执行结束后,会生成一个 CPU 的采样文件: /tmp/runtime_cpu.pprof, 我们继续使用 Web UI 打开:
$ go tool pprof -http=:6062 /tmp/runtime_cpu.pprof$ go tool pprof -http=:6062 /tmp/runtime_cpu.pprof打开后的页面如图所示,功能点在前文 Web UI 小节已经讲过了,这里不再赘述。
采样其他指标数据
除了采样 CPU 的数据,也可以通过指定参数来采样其他数据,因为标准库的采样方法使用起来有些繁琐,我们这里使用开源的 profile 作为演示。
在刚才的例子代码基础上稍作修改,将 CPU 采样改为内存采样,代码如下:
package main

import (
	"github.com/pkg/profile"
	"math/rand"
	"sort"
)

func main() {
	// 开始内存采样
	defer profile.Start(profile.MemProfile, profile.MemProfileRate(1)).Stop()

	// 每次生成 10000 个随机数字进行排序
	for i := 0; i < 1024; i++ {
		nums := genRandomNumbers(10000)
		sort.Slice(nums, func(i, j int) bool {
			return nums[i] < nums[j]
		})
	}
}

// 生成随机数切片
func genRandomNumbers(n int) []int {
	nums := make([]int, n)
	for i := 1; i < n; i++ {
		nums[i] = rand.Int()
	}
	return nums
}
package main
import (
"github.com/pkg/profile"
"math/rand"
"sort"
)
func main() {
// 开始内存采样
defer profile.Start(profile.MemProfile, profile.MemProfileRate(1)).Stop()
// 每次生成 10000 个随机数字进行排序
for i := 0; i < 1024; i++ {
nums := genRandomNumbers(10000)
sort.Slice(nums, func(i, j int) bool {
return nums[i] < nums[j]
})
}
}
// 生成随机数切片
func genRandomNumbers(n int) []int {
nums := make([]int, n)
for i := 1; i < n; i++ {
nums[i] = rand.Int()
}
return nums
}直接运行:
$ go run main.go$ go run main.go输出结果如下 (具体路径取决于操作系统):
2023/07/29 11:54:55 profile: memory profiling enabled (rate 1), /tmp/profile3144997289/mem.pprof
2023/07/29 11:54:56 profile: memory profiling disabled, /tmp/profile3144997289/mem.pprof
2023/07/29 11:54:55 profile: memory profiling enabled (rate 1), /tmp/profile3144997289/mem.pprof
2023/07/29 11:54:56 profile: memory profiling disabled, /tmp/profile3144997289/mem.pprof使用 Web UI 打开内存采样文件,数据页面展示如下,读者可以对比一下和 CPU 采样数据页面的差异。
$ go tool pprof -http=:6062 /tmp/profile3144997289/mem.pprof$ go tool pprof -http=:6062 /tmp/profile3144997289/mem.pprof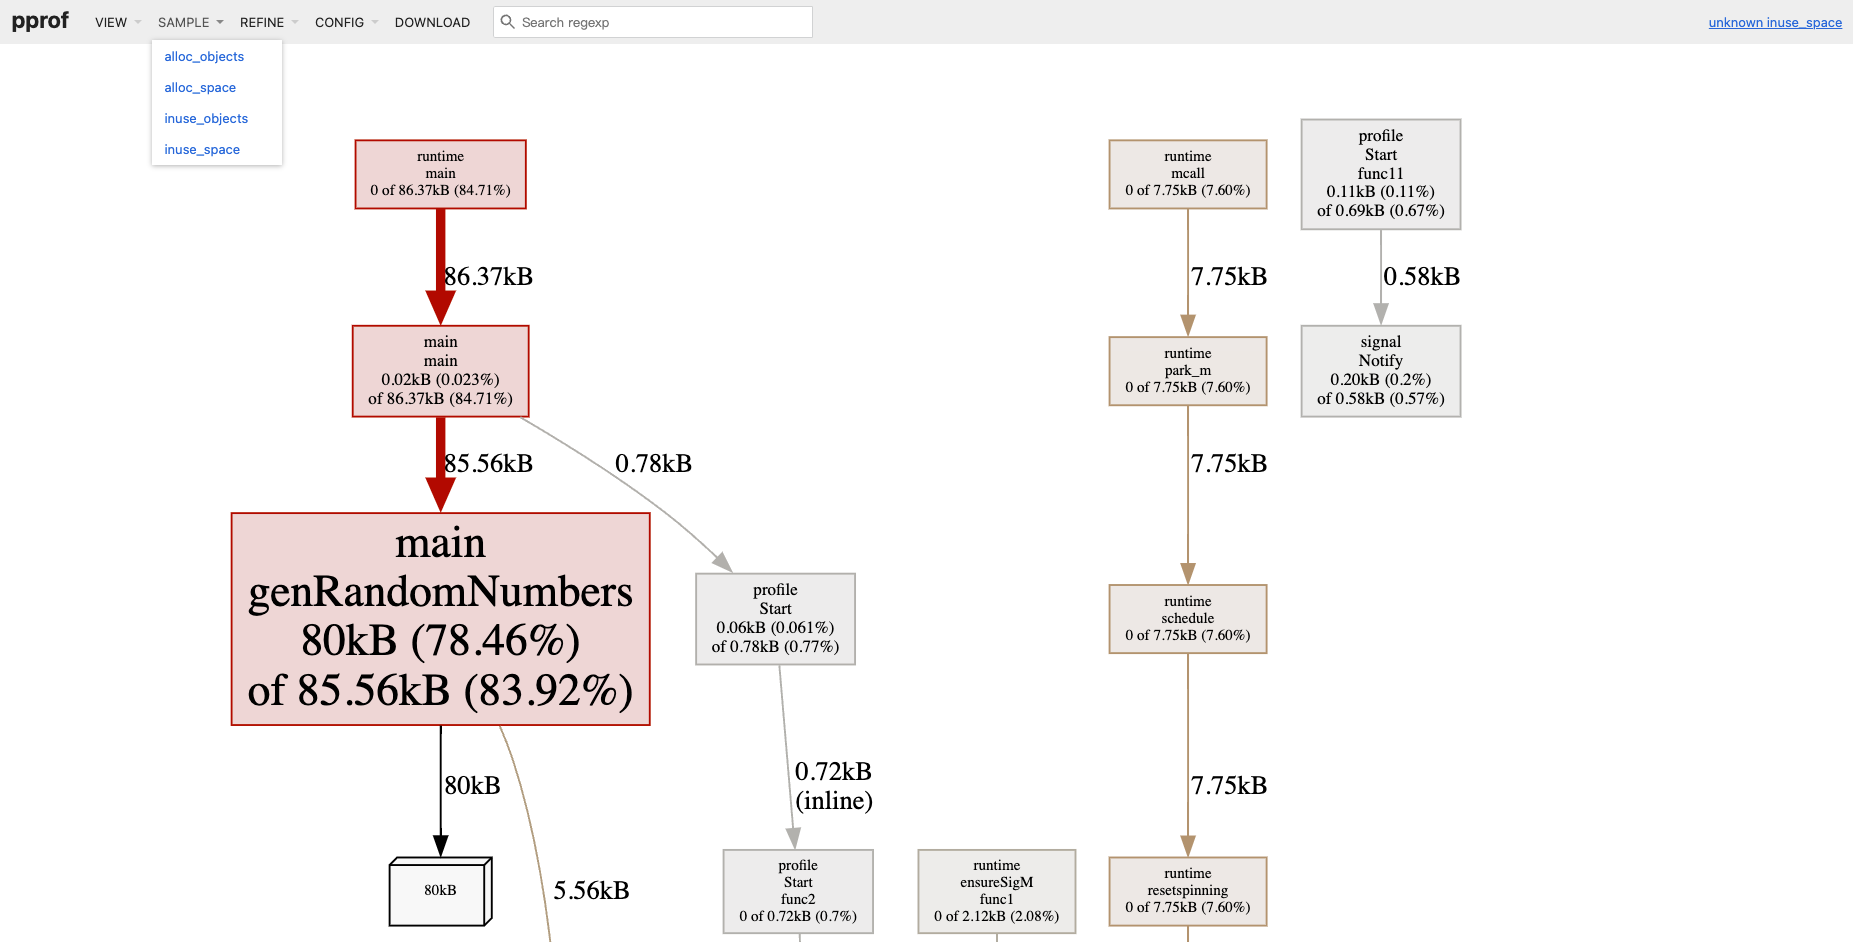
采样其他指标数据
参考官方的示例代码。
package main

import (
	"flag"
	"github.com/pkg/profile"
)

func main() {
	// use the flags package to selectively enable profiling.
	mode := flag.String("profile.mode", "", "enable profiling mode, one of [cpu, mem, mutex, block]")
	flag.Parse()
	switch *mode {
	case "cpu":
		defer profile.Start(profile.CPUProfile).Stop()
	case "mem":
		defer profile.Start(profile.MemProfile).Stop()
	case "mutex":
		defer profile.Start(profile.MutexProfile).Stop()
	case "block":
		defer profile.Start(profile.BlockProfile).Stop()
	default:
		// do nothing
	}
}
package main
import (
"flag"
"github.com/pkg/profile"
)
func main() {
// use the flags package to selectively enable profiling.
mode := flag.String("profile.mode", "", "enable profiling mode, one of [cpu, mem, mutex, block]")
flag.Parse()
switch *mode {
case "cpu":
defer profile.Start(profile.CPUProfile).Stop()
case "mem":
defer profile.Start(profile.MemProfile).Stop()
case "mutex":
defer profile.Start(profile.MutexProfile).Stop()
case "block":
defer profile.Start(profile.BlockProfile).Stop()
default:
// do nothing
}
}通过单元测试采样
除了 Web 和后台服务中可以采样,在单元测试中也可以采样:
# CPU 采样
$ go test -v -bench="XXX$" -run='XXX$' -cpuprofile=cpu.pprof .

# 内存 采样
$ go test -v -bench="XXX$" -run='XXX$' -cpuprofile=cpu.pprof .

# trace 采样
$ go test -v -bench="XXX$" -run='XXX$' -trace=trace.out
# CPU 采样
$ go test -v -bench="XXX$" -run='XXX$' -cpuprofile=cpu.pprof .
# 内存 采样
$ go test -v -bench="XXX$" -run='XXX$' -cpuprofile=cpu.pprof .
# trace 采样
$ go test -v -bench="XXX$" -run='XXX$' -trace=trace.out限于篇幅,数据采样过程和分析过程这里不再演示,感兴趣的读者直接参照前文的示例进行试验。
最佳实践
- 优化工作在大部分情况下,内存分析 (例如 go tool pprof –alloc_objects app mem.pprof) 通常比 CPU 耗时分析 (例如 go tool pprof app cpu.pprof) 更容易分析性能瓶颈
- 通过 goroutine 采样来分析 goroutine 泄漏问题 (例如访问 http://127.0.0.1:6060/debug/pprof/goroutine?debug=1,查看 goroutine profile 数量),原理类似 这篇文章中提到的
- 指定代码块进行采样 (例如使用 pprof.StartCPUProfile() 和 pprof.StopCPUProfile() 指定要采样的代码块)
- 对于 hot path 上面的代码,在单元测试期间就要进行性能采样分析
- 生产环境 不要将 pprof HTTP 服务直接暴露给外部或公共网络,以防止未经授权的访问,只有在需要进行性能分析时启动该服务
- 生产环境 中设置专门用于采样的服务容器 (例如和灰度类似的采样服务),设置负载均衡自动分配一定百分比的生产流量到采样服务,线上遇到问题时就可以第一时间进行处理
- 生产环境 中设置自定义的 pprof PATH,例如 Gin pprof 中提供的 API, 或者 这个示例程序
总结
本文主要讲述了 Go 语言自带的性能分析套件 pprof 和 trace, 再加上以前的这两篇文章 GODEBUG 环境变量详解, Go Delve 调试必知必会, 可以将这几项工具组合成一把 Go 语言程序调试的 “瑞士军刀”。
Reference
扩展阅读
- Go 语言高性能 Tips
- fgprof
- off cpu analysis
- pprof++: A Go Profiler with Hardware Performance Monitoring
- GopherCon 2018 - Allocator Wrestling
- Program Profiling
- Go 语言-计算密集型服务 性能优化
- Go 语言-IO密集型服务 性能优化
- 字节大规模微服务语言发展之路
- Go系统性能绕坑工具与方法 - 基于实例的带逛
- go-execution-tracer
- go-perfbook
- 最常用的调试 golang 的 bug 以及性能问题的实践方法
- 快速定位线上性能问题:Profiling 在微服务应用下的落地实践
- pprof-web
- fgprof
- profilinggo
- Cloud Profiler
- pprof 统计的内存总是偏小?
- 对 Go 程序进行可靠的性能测试
- 寻找性能瓶颈
- 无人值守的自动 dump(二)
- self-aware Golang profile dumper