 SRE文档
SRE文档1,索引
11.1 Btree索引详解
当表数据量越来越大时查询速度会下降,像课本目录一样,在表的条件字段上创建索引,查询时能够快速定位感兴趣的数据所在的位置。索引的好处主要有加速带条件的查询,删除,更新,加速JOIN操作,加速外键约束更新和删除的操作等,但是索引也不是只有好处没有坏处,创建索引时会锁表,不仅将数据写入表中,还要创建索引,因此会在一定程度上影响写的性能
Btree索引适合处理能够按顺序存储的数据的=,<,>,<=,>=,以及等效这些操作符的其他操作如BETWEEN,IN以及IS NULL和以字符串开头的模糊查询。Btree索引要想起作用where条件必须包含第一个索引列
-- 创建表
postgres@han_db=>create table tbl_index(a bigint,b timestamp without time zone,c varchar(12));
CREATE TABLE

-- 插入数据
postgres@han_db=>insert into tbl_index (a,b,c)  select generate_series(1,3000000),clock_timestamp()::timestamp(0) without time zone,'got u';
INSERT 0 3000000

postgres@han_db=>\timing
Timing is on.

-- 创建索引前查询
postgres@han_db=> select * from tbl_index where a=3000000;
    a    |          b          |   c
---------+---------------------+-------
 3000000 | 2020-08-11 16:00:13 | got u
(1 row)

Time: 117.992 ms


-- 创建索引
postgres@han_db=>create index idx_tbl_index_a on tbl_index using btree(a);
CREATE INDEX
Time: 1194.789 ms (00:01.195)

-- 创建索引后查询
postgres@han_db=>select * from tbl_index where a=3000000;
    a    |          b          |   c
---------+---------------------+-------
 3000000 | 2020-08-11 16:00:13 | got u
(1 row)

Time: 2.090 ms


-- 删除索引
postgres@han_db=>drop index idx_tbl_index_a ;
DROP INDEX
Time: 117.472 ms

-- 创建组合索引
postgres@han_db=>create index idx_tbl_index_a_b on tbl_index using btree(a,b);

-- 按字段a查询
postgres@han_db=>explain analyze select * from tbl_index where a=3000000;
                                                          QUERY PLAN
------------------------------------------------------------------------------------------------------------------------------
 Index Scan using idx_tbl_index_a_b on tbl_index  (cost=0.43..8.45 rows=1 width=22) (actual time=0.033..0.035 rows=1 loops=1)
   Index Cond: (a = 3000000)
 Planning Time: 0.124 ms
 Execution Time: 0.069 ms
(4 rows)

-- 按字段b查询
postgres@han_db=>explain analyze select * from tbl_index where b='2016-06-29 14:54:00';
                                                        QUERY PLAN
---------------------------------------------------------------------------------------------------------------------------
 Gather  (cost=1000.00..35734.10 rows=1 width=22) (actual time=122.301..122.992 rows=0 loops=1)
   Workers Planned: 2
   Workers Launched: 2
   ->  Parallel Seq Scan on tbl_index  (cost=0.00..34734.00 rows=1 width=22) (actual time=105.028..105.028 rows=0 loops=3)
         Filter: (b = '2016-06-29 14:54:00'::timestamp without time zone)
         Rows Removed by Filter: 1000000
 Planning Time: 0.176 ms
 Execution Time: 123.019 ms
(8 rows)
Time: 1.096 ms

-- 组合字段查询 a and b
postgres@han_db=>explain analyze select * from tbl_index where a=3000000 and b='2016-06-29 14:54:00';
                                                          QUERY PLAN
------------------------------------------------------------------------------------------------------------------------------
 Index Scan using idx_tbl_index_a_b on tbl_index  (cost=0.43..6.20 rows=1 width=22) (actual time=0.030..0.030 rows=0 loops=1)
   Index Cond: ((a = 3000000) AND (b = '2016-06-29 14:54:00'::timestamp without time zone))
 Planning Time: 0.145 ms
 Execution Time: 0.063 ms
(4 rows)

Time: 1.028 ms

-- 组合字段查询 a or b
postgres@han_db=>explain analyze select * from tbl_index where a=3000000 or b='2016-06-29 14:54:00';
                                                        QUERY PLAN
---------------------------------------------------------------------------------------------------------------------------
 Gather  (cost=1000.00..38859.10 rows=1 width=22) (actual time=125.031..125.298 rows=1 loops=1)
   Workers Planned: 2
   Workers Launched: 2
   ->  Parallel Seq Scan on tbl_index  (cost=0.00..37859.00 rows=1 width=22) (actual time=111.156..111.157 rows=0 loops=3)
         Filter: ((a = 3000000) OR (b = '2016-06-29 14:54:00'::timestamp without time zone))
         Rows Removed by Filter: 1000000
 Planning Time: 0.143 ms
 Execution Time: 125.341 ms
(8 rows)

Time: 126.176 ms


表中的索引实际是btree(a,b),从以上示例中可以看出,只有where条件包含索引的第一个字段,查询才会进行索引扫描,否则将进行全表扫描。

or,组合索引字段间使用and和or(测试例使用pg9.6,记得低版本pg组合索引使用or查询会进行全表扫描)虽然都是索引扫描,但是and组合要比or组合查询速度更快


-- 删除组合索引
postgres@han_db=>drop index idx_tbl_index_a_b;
DROP INDEX
Time: 27.107 ms

-- 分别在a和b字段上创建索引
postgres@han_db=>create index idx_tbl_index_a on tbl_index using btree (a);
CREATE INDEX
Time: 841.557 ms

postgres@han_db=>create index idx_tbl_index_b on tbl_index using btree (b);
CREATE INDEX
Time: 1022.271 ms (00:01.022)

-- 分别使用a and b和a or b进行查询
postgres@han_db=>explain analyze select * from tbl_index where a=3000000 and b='2016-06-29 14:54:00';
                                                         QUERY PLAN
----------------------------------------------------------------------------------------------------------------------------
 Index Scan using idx_tbl_index_b on tbl_index  (cost=0.43..4.45 rows=1 width=22) (actual time=0.115..0.115 rows=0 loops=1)
   Index Cond: (b = '2016-06-29 14:54:00'::timestamp without time zone)
   Filter: (a = 3000000)
 Planning Time: 0.873 ms
 Execution Time: 0.164 ms
(5 rows)

Time: 2.353 ms


postgres@han_db=>explain analyze select * from tbl_index where a=3000000 or b='2016-06-29 14:54:00';
                                                          QUERY PLAN
------------------------------------------------------------------------------------------------------------------------------
 Bitmap Heap Scan on tbl_index  (cost=8.88..12.89 rows=1 width=22) (actual time=0.172..0.174 rows=1 loops=1)
   Recheck Cond: ((a = 3000000) OR (b = '2016-06-29 14:54:00'::timestamp without time zone))
   Heap Blocks: exact=1
   ->  BitmapOr  (cost=8.88..8.88 rows=1 width=0) (actual time=0.163..0.163 rows=0 loops=1)
         ->  Bitmap Index Scan on idx_tbl_index_a  (cost=0.00..4.44 rows=1 width=0) (actual time=0.148..0.149 rows=1 loops=1)
               Index Cond: (a = 3000000)
         ->  Bitmap Index Scan on idx_tbl_index_b  (cost=0.00..4.44 rows=1 width=0) (actual time=0.013..0.013 rows=0 loops=1)
               Index Cond: (b = '2016-06-29 14:54:00'::timestamp without time zone)
 Planning Time: 0.148 ms
 Execution Time: 0.243 ms
(10 rows)

Time: 1.567 ms

结果显示分别在a和b字段上创建索引与在(a,b)组合字段上创建索引相比,and查询性能下降,但是or的性能可以提升
-- 创建表
postgres@han_db=>create table tbl_index(a bigint,b timestamp without time zone,c varchar(12));
CREATE TABLE
-- 插入数据
postgres@han_db=>insert into tbl_index (a,b,c) select generate_series(1,3000000),clock_timestamp()::timestamp(0) without time zone,'got u';
INSERT 0 3000000
postgres@han_db=>\timing
Timing is on.
-- 创建索引前查询
postgres@han_db=> select * from tbl_index where a=3000000;
a | b | c
---------+---------------------+-------
3000000 | 2020-08-11 16:00:13 | got u
(1 row)
Time: 117.992 ms
-- 创建索引
postgres@han_db=>create index idx_tbl_index_a on tbl_index using btree(a);
CREATE INDEX
Time: 1194.789 ms (00:01.195)
-- 创建索引后查询
postgres@han_db=>select * from tbl_index where a=3000000;
a | b | c
---------+---------------------+-------
3000000 | 2020-08-11 16:00:13 | got u
(1 row)
Time: 2.090 ms
-- 删除索引
postgres@han_db=>drop index idx_tbl_index_a ;
DROP INDEX
Time: 117.472 ms
-- 创建组合索引
postgres@han_db=>create index idx_tbl_index_a_b on tbl_index using btree(a,b);
-- 按字段a查询
postgres@han_db=>explain analyze select * from tbl_index where a=3000000;
QUERY PLAN
------------------------------------------------------------------------------------------------------------------------------
Index Scan using idx_tbl_index_a_b on tbl_index (cost=0.43..8.45 rows=1 width=22) (actual time=0.033..0.035 rows=1 loops=1)
Index Cond: (a = 3000000)
Planning Time: 0.124 ms
Execution Time: 0.069 ms
(4 rows)
-- 按字段b查询
postgres@han_db=>explain analyze select * from tbl_index where b='2016-06-29 14:54:00';
QUERY PLAN
---------------------------------------------------------------------------------------------------------------------------
Gather (cost=1000.00..35734.10 rows=1 width=22) (actual time=122.301..122.992 rows=0 loops=1)
Workers Planned: 2
Workers Launched: 2
-> Parallel Seq Scan on tbl_index (cost=0.00..34734.00 rows=1 width=22) (actual time=105.028..105.028 rows=0 loops=3)
Filter: (b = '2016-06-29 14:54:00'::timestamp without time zone)
Rows Removed by Filter: 1000000
Planning Time: 0.176 ms
Execution Time: 123.019 ms
(8 rows)
Time: 1.096 ms
-- 组合字段查询 a and b
postgres@han_db=>explain analyze select * from tbl_index where a=3000000 and b='2016-06-29 14:54:00';
QUERY PLAN
------------------------------------------------------------------------------------------------------------------------------
Index Scan using idx_tbl_index_a_b on tbl_index (cost=0.43..6.20 rows=1 width=22) (actual time=0.030..0.030 rows=0 loops=1)
Index Cond: ((a = 3000000) AND (b = '2016-06-29 14:54:00'::timestamp without time zone))
Planning Time: 0.145 ms
Execution Time: 0.063 ms
(4 rows)
Time: 1.028 ms
-- 组合字段查询 a or b
postgres@han_db=>explain analyze select * from tbl_index where a=3000000 or b='2016-06-29 14:54:00';
QUERY PLAN
---------------------------------------------------------------------------------------------------------------------------
Gather (cost=1000.00..38859.10 rows=1 width=22) (actual time=125.031..125.298 rows=1 loops=1)
Workers Planned: 2
Workers Launched: 2
-> Parallel Seq Scan on tbl_index (cost=0.00..37859.00 rows=1 width=22) (actual time=111.156..111.157 rows=0 loops=3)
Filter: ((a = 3000000) OR (b = '2016-06-29 14:54:00'::timestamp without time zone))
Rows Removed by Filter: 1000000
Planning Time: 0.143 ms
Execution Time: 125.341 ms
(8 rows)
Time: 126.176 ms
表中的索引实际是btree(a,b),从以上示例中可以看出,只有where条件包含索引的第一个字段,查询才会进行索引扫描,否则将进行全表扫描。
or,组合索引字段间使用and和or(测试例使用pg9.6,记得低版本pg组合索引使用or查询会进行全表扫描)虽然都是索引扫描,但是and组合要比or组合查询速度更快
-- 删除组合索引
postgres@han_db=>drop index idx_tbl_index_a_b;
DROP INDEX
Time: 27.107 ms
-- 分别在a和b字段上创建索引
postgres@han_db=>create index idx_tbl_index_a on tbl_index using btree (a);
CREATE INDEX
Time: 841.557 ms
postgres@han_db=>create index idx_tbl_index_b on tbl_index using btree (b);
CREATE INDEX
Time: 1022.271 ms (00:01.022)
-- 分别使用a and b和a or b进行查询
postgres@han_db=>explain analyze select * from tbl_index where a=3000000 and b='2016-06-29 14:54:00';
QUERY PLAN
----------------------------------------------------------------------------------------------------------------------------
Index Scan using idx_tbl_index_b on tbl_index (cost=0.43..4.45 rows=1 width=22) (actual time=0.115..0.115 rows=0 loops=1)
Index Cond: (b = '2016-06-29 14:54:00'::timestamp without time zone)
Filter: (a = 3000000)
Planning Time: 0.873 ms
Execution Time: 0.164 ms
(5 rows)
Time: 2.353 ms
postgres@han_db=>explain analyze select * from tbl_index where a=3000000 or b='2016-06-29 14:54:00';
QUERY PLAN
------------------------------------------------------------------------------------------------------------------------------
Bitmap Heap Scan on tbl_index (cost=8.88..12.89 rows=1 width=22) (actual time=0.172..0.174 rows=1 loops=1)
Recheck Cond: ((a = 3000000) OR (b = '2016-06-29 14:54:00'::timestamp without time zone))
Heap Blocks: exact=1
-> BitmapOr (cost=8.88..8.88 rows=1 width=0) (actual time=0.163..0.163 rows=0 loops=1)
-> Bitmap Index Scan on idx_tbl_index_a (cost=0.00..4.44 rows=1 width=0) (actual time=0.148..0.149 rows=1 loops=1)
Index Cond: (a = 3000000)
-> Bitmap Index Scan on idx_tbl_index_b (cost=0.00..4.44 rows=1 width=0) (actual time=0.013..0.013 rows=0 loops=1)
Index Cond: (b = '2016-06-29 14:54:00'::timestamp without time zone)
Planning Time: 0.148 ms
Execution Time: 0.243 ms
(10 rows)
Time: 1.567 ms
结果显示分别在a和b字段上创建索引与在(a,b)组合字段上创建索引相比,and查询性能下降,但是or的性能可以提升11.2 Gist索引
GiST的意思是通用的搜索树(Generalized Search Tree)。 它是一种平衡树结构的访问方法,在系统中作为一个基本模版,可以使用它实现任意索引模式。B-trees, R-trees和许多其它的索引模式都可以用GiST实现
与Btree索引比较的优缺点
| 与Btree索引比较的优缺点 | |
|---|---|
| 优点 | Gist索引适用于多维数据类型和集合数据类型,和Btree索引类似,同样适用于其他的数据类型。和Btree索引相比,Gist多字段索引在查询条件中包含索引字段的任何子集都会使用索引扫描,而Btree索引只有查询条件包含第一个索引字段才会使用索引扫描 |
| 缺点 | Gist索引创建耗时较长,占用空间也比较大 |
-- 测试表
postgres@han_db=> create table tbl_index(a bigint,b timestamp without time zone,c varchar(12));
CREATE TABLE
Time: 5.771 ms

-- 插入数据
postgres@han_db=>insert into tbl_index (a,b,c)  select generate_series(1,3000000),clock_timestamp()::timestamp(0) without time zone,'got u';
INSERT 0 3000000
Time: 3018.547 ms (00:03.019)


-- 创建扩展btree_gist,
postgres@postgres=>create extension btree_gist;
CREATE EXTENSION

-- 创建索引
postgres@han_db=>create index idx_gist_tbl_index_a_b on tbl_index using gist(a,b);
CREATE INDEX
Time: 34898.653 ms (00:34.899)

--如果没有在库里创建扩展,则会出现
postgres@han_db=>create index idx_gist_tbl_index_a_b on tbl_index using gist(a,b);
ERROR:  data type bigint has no default operator class for access method "gist"
HINT:  You must specify an operator class for the index or define a default operator class for the data type.


-- 使用字段a查询
postgres@han_db=> explain analyze select * from tbl_index where a=3000000;
                                                       QUERY PLAN
-------------------------------------------------------------------------------------------------------------------------
 Gather  (cost=1000.00..35734.10 rows=1 width=22) (actual time=80.218..84.883 rows=1 loops=1)
   Workers Planned: 2
   Workers Launched: 2
   ->  Parallel Seq Scan on tbl_index  (cost=0.00..34734.00 rows=1 width=22) (actual time=75.100..75.100 rows=0 loops=3)
         Filter: (a = 3000000)
         Rows Removed by Filter: 1000000
 Planning Time: 0.227 ms
 Execution Time: 84.897 ms
(8 rows)

Time: 85.528 ms

a,b 以上两条SQL语句的区别在于第一条SQL语句按照a的类型bigint去查询,而第二条SQL语句却将bigint转成char类型查询,但是结果显示char类型的查询(索引扫描)性能远高于bigint的查询(全表扫描)性能,怀疑是不是创建索引时将bigint转成char类型了,反正Gist索引查询最好使用char


-- 示例2.使用字段b查询
postgres@han_db=>explain analyze select * from tbl_index where b='2016-06-29 14:54:00';
                                                            QUERY PLAN

-------------------------------------------------------------------------------------------------------------------------------
----
 Index Scan using idx_gist_tbl_index_a_b on tbl_index  (cost=0.41..8.43 rows=1 width=22) (actual time=0.011..0.011 rows=0 loops
=1)
   Index Cond: (b = '2016-06-29 14:54:00'::timestamp without time zone)
 Planning Time: 0.098 ms
 Execution Time: 0.024 ms
(4 rows)

Time: 1.336 ms
该查询不包含第一个索引字段,但是仍使用索引扫描,而此条件下Btree索引只能全表扫描


-- 示例3.使用a and b查询
postgres@han_db=> explain analyze select * from tbl_index where a='3000000' and b='2016-06-29 14:54:00';
                                                            QUERY PLAN

-------------------------------------------------------------------------------------------------------------------------------
----
 Index Scan using idx_gist_tbl_index_a_b on tbl_index  (cost=0.41..8.43 rows=1 width=22) (actual time=0.011..0.011 rows=0 loops
=1)
   Index Cond: ((a = '3000000'::bigint) AND (b = '2016-06-29 14:54:00'::timestamp without time zone))
 Planning Time: 0.060 ms
 Execution Time: 0.026 ms
(4 rows)

Time: 0.449 ms

--示例4.使用a or b查询
postgres@han_db=> explain analyze select * from tbl_index where a='3000000' or b='2016-06-29 14:54:00';
                                                             QUERY PLAN

-------------------------------------------------------------------------------------------------------------------------------
------
 Bitmap Heap Scan on tbl_index  (cost=8.84..12.86 rows=1 width=22) (actual time=0.023..0.023 rows=1 loops=1)
   Recheck Cond: ((a = '3000000'::bigint) OR (b = '2016-06-29 14:54:00'::timestamp without time zone))
   Heap Blocks: exact=1
   ->  BitmapOr  (cost=8.84..8.84 rows=1 width=0) (actual time=0.019..0.019 rows=0 loops=1)
         ->  Bitmap Index Scan on idx_gist_tbl_index_a_b  (cost=0.00..4.42 rows=1 width=0) (actual time=0.017..0.017 rows=1 loo
ps=1)
               Index Cond: (a = '3000000'::bigint)
         ->  Bitmap Index Scan on idx_gist_tbl_index_a_b  (cost=0.00..4.42 rows=1 width=0) (actual time=0.001..0.001 rows=0 loo
ps=1)
               Index Cond: (b = '2016-06-29 14:54:00'::timestamp without time zone)
 Planning Time: 0.052 ms
 Execution Time: 0.048 ms
(10 rows)

Time: 0.650 ms

使用and和or查询虽然也是索引扫描,但是和Btree索引相比并没有性能提升


-- 查看索引大小
postgres@han_db=>select relname,pg_size_pretty(pg_relation_size(oid)) from pg_class where relname like 'idx_%_tbl_index_a_b';
         relname         | pg_size_pretty
-------------------------+----------------
 idx_btree_tbl_index_a_b | 90 MB
 idx_gist_tbl_index_a_b  | 286 MB
(2 rows)

Time: 0.858 ms
-- 测试表
postgres@han_db=> create table tbl_index(a bigint,b timestamp without time zone,c varchar(12));
CREATE TABLE
Time: 5.771 ms
-- 插入数据
postgres@han_db=>insert into tbl_index (a,b,c) select generate_series(1,3000000),clock_timestamp()::timestamp(0) without time zone,'got u';
INSERT 0 3000000
Time: 3018.547 ms (00:03.019)
-- 创建扩展btree_gist,
postgres@postgres=>create extension btree_gist;
CREATE EXTENSION
-- 创建索引
postgres@han_db=>create index idx_gist_tbl_index_a_b on tbl_index using gist(a,b);
CREATE INDEX
Time: 34898.653 ms (00:34.899)
--如果没有在库里创建扩展,则会出现
postgres@han_db=>create index idx_gist_tbl_index_a_b on tbl_index using gist(a,b);
ERROR: data type bigint has no default operator class for access method "gist"
HINT: You must specify an operator class for the index or define a default operator class for the data type.
-- 使用字段a查询
postgres@han_db=> explain analyze select * from tbl_index where a=3000000;
QUERY PLAN
-------------------------------------------------------------------------------------------------------------------------
Gather (cost=1000.00..35734.10 rows=1 width=22) (actual time=80.218..84.883 rows=1 loops=1)
Workers Planned: 2
Workers Launched: 2
-> Parallel Seq Scan on tbl_index (cost=0.00..34734.00 rows=1 width=22) (actual time=75.100..75.100 rows=0 loops=3)
Filter: (a = 3000000)
Rows Removed by Filter: 1000000
Planning Time: 0.227 ms
Execution Time: 84.897 ms
(8 rows)
Time: 85.528 ms
a,b 以上两条SQL语句的区别在于第一条SQL语句按照a的类型bigint去查询,而第二条SQL语句却将bigint转成char类型查询,但是结果显示char类型的查询(索引扫描)性能远高于bigint的查询(全表扫描)性能,怀疑是不是创建索引时将bigint转成char类型了,反正Gist索引查询最好使用char
-- 示例2.使用字段b查询
postgres@han_db=>explain analyze select * from tbl_index where b='2016-06-29 14:54:00';
QUERY PLAN
-------------------------------------------------------------------------------------------------------------------------------
----
Index Scan using idx_gist_tbl_index_a_b on tbl_index (cost=0.41..8.43 rows=1 width=22) (actual time=0.011..0.011 rows=0 loops
=1)
Index Cond: (b = '2016-06-29 14:54:00'::timestamp without time zone)
Planning Time: 0.098 ms
Execution Time: 0.024 ms
(4 rows)
Time: 1.336 ms
该查询不包含第一个索引字段,但是仍使用索引扫描,而此条件下Btree索引只能全表扫描
-- 示例3.使用a and b查询
postgres@han_db=> explain analyze select * from tbl_index where a='3000000' and b='2016-06-29 14:54:00';
QUERY PLAN
-------------------------------------------------------------------------------------------------------------------------------
----
Index Scan using idx_gist_tbl_index_a_b on tbl_index (cost=0.41..8.43 rows=1 width=22) (actual time=0.011..0.011 rows=0 loops
=1)
Index Cond: ((a = '3000000'::bigint) AND (b = '2016-06-29 14:54:00'::timestamp without time zone))
Planning Time: 0.060 ms
Execution Time: 0.026 ms
(4 rows)
Time: 0.449 ms
--示例4.使用a or b查询
postgres@han_db=> explain analyze select * from tbl_index where a='3000000' or b='2016-06-29 14:54:00';
QUERY PLAN
-------------------------------------------------------------------------------------------------------------------------------
------
Bitmap Heap Scan on tbl_index (cost=8.84..12.86 rows=1 width=22) (actual time=0.023..0.023 rows=1 loops=1)
Recheck Cond: ((a = '3000000'::bigint) OR (b = '2016-06-29 14:54:00'::timestamp without time zone))
Heap Blocks: exact=1
-> BitmapOr (cost=8.84..8.84 rows=1 width=0) (actual time=0.019..0.019 rows=0 loops=1)
-> Bitmap Index Scan on idx_gist_tbl_index_a_b (cost=0.00..4.42 rows=1 width=0) (actual time=0.017..0.017 rows=1 loo
ps=1)
Index Cond: (a = '3000000'::bigint)
-> Bitmap Index Scan on idx_gist_tbl_index_a_b (cost=0.00..4.42 rows=1 width=0) (actual time=0.001..0.001 rows=0 loo
ps=1)
Index Cond: (b = '2016-06-29 14:54:00'::timestamp without time zone)
Planning Time: 0.052 ms
Execution Time: 0.048 ms
(10 rows)
Time: 0.650 ms
使用and和or查询虽然也是索引扫描,但是和Btree索引相比并没有性能提升
-- 查看索引大小
postgres@han_db=>select relname,pg_size_pretty(pg_relation_size(oid)) from pg_class where relname like 'idx_%_tbl_index_a_b';
relname | pg_size_pretty
-------------------------+----------------
idx_btree_tbl_index_a_b | 90 MB
idx_gist_tbl_index_a_b | 286 MB
(2 rows)
Time: 0.858 ms唯一索引
唯一索引字面上理解就是在索引上增加唯一约束,不允许出现索引值相同的行,目前只有Btree索引可以声明唯一索引,唯一键会自动创建唯一索引
postgres@han_db=>create table tbl_unique_index(a int, b int);
CREATE TABLE
Time: 5.789 ms

-- 示例1.创建唯一索引,相等数据只允许插入一行,NULL除外,因为NULL不等于NULL
postgres@han_db=>create unique index idx_unq_tbl_unique_index_a_b on tbl_unique_index using btree (a,b);
CREATE INDEX
Time: 4.245 ms

-- 查看索引
postgres@han_db=>\d tbl_unique_index
          Table "public.tbl_unique_index"
 Column |  Type   | Collation | Nullable | Default
--------+---------+-----------+----------+---------
 a      | integer |           |          |
 b      | integer |           |          |
Indexes:
    "idx_unq_tbl_unique_index_a_b" UNIQUE, btree (a, b)


postgres@han_db=>insert into tbl_unique_index values (1,1);
ERROR:  duplicate key value violates unique constraint "idx_unq_tbl_unique_index_a_b"
DETAIL:  Key (a, b)=(1, 1) already exists.
Time: 0.536 ms

postgres@han_db=>insert into tbl_unique_index values (1);
INSERT 0 1
Time: 1.357 ms

postgres@han_db=>insert into tbl_unique_index values (1);
INSERT 0 1
Time: 2.946 ms

postgres@han_db=>insert into tbl_unique_index values (1);
INSERT 0 1
Time: 2.900 ms

-- 示例2.唯一键会自动创建唯一索引
#清空表
postgres@han_db=>truncate table tbl_unique_index ;
TRUNCATE TABLE

-- 添加索引
postgres@han_db=>alter table tbl_unique_index add constraint pk_tbl_unique_index_a primary key(a);
ALTER TABLE

postgres@han_db=>alter table tbl_unique_index add constraint uk_tbl_unique_index_b unique(b);
ALTER TABLE

postgres@han_db=> \d tbl_unique_index
          Table "public.tbl_unique_index"
 Column |  Type   | Collation | Nullable | Default
--------+---------+-----------+----------+---------
 a      | integer |           | not null |
 b      | integer |           |          |
Indexes:
    "pk_tbl_unique_index_a" PRIMARY KEY, btree (a)
    "idx_unq_tbl_unique_index_a_b" UNIQUE, btree (a, b)
    "uk_tbl_unique_index_b" UNIQUE CONSTRAINT, btree (b)

-- 插入实例
postgres@han_db=>insert into tbl_unique_index values (1);
INSERT 0 1

postgres@han_db=>insert into tbl_unique_index values (1);
ERROR:  duplicate key value violates unique constraint "pk_tbl_unique_index_a"
DETAIL:  Key (a)=(1) already exists.

postgres@han_db=>insert into tbl_unique_index values (1);
ERROR:  duplicate key value violates unique constraint "pk_tbl_unique_index_a"
DETAIL: Key (a)=(1) already exists.postgres@han_db=>create table tbl_unique_index(a int, b int);
CREATE TABLE
Time: 5.789 ms
-- 示例1.创建唯一索引,相等数据只允许插入一行,NULL除外,因为NULL不等于NULL
postgres@han_db=>create unique index idx_unq_tbl_unique_index_a_b on tbl_unique_index using btree (a,b);
CREATE INDEX
Time: 4.245 ms
-- 查看索引
postgres@han_db=>\d tbl_unique_index
Table "public.tbl_unique_index"
Column | Type | Collation | Nullable | Default
--------+---------+-----------+----------+---------
a | integer | | |
b | integer | | |
Indexes:
"idx_unq_tbl_unique_index_a_b" UNIQUE, btree (a, b)
postgres@han_db=>insert into tbl_unique_index values (1,1);
ERROR: duplicate key value violates unique constraint "idx_unq_tbl_unique_index_a_b"
DETAIL: Key (a, b)=(1, 1) already exists.
Time: 0.536 ms
postgres@han_db=>insert into tbl_unique_index values (1);
INSERT 0 1
Time: 1.357 ms
postgres@han_db=>insert into tbl_unique_index values (1);
INSERT 0 1
Time: 2.946 ms
postgres@han_db=>insert into tbl_unique_index values (1);
INSERT 0 1
Time: 2.900 ms
-- 示例2.唯一键会自动创建唯一索引
#清空表
postgres@han_db=>truncate table tbl_unique_index ;
TRUNCATE TABLE
-- 添加索引
postgres@han_db=>alter table tbl_unique_index add constraint pk_tbl_unique_index_a primary key(a);
ALTER TABLE
postgres@han_db=>alter table tbl_unique_index add constraint uk_tbl_unique_index_b unique(b);
ALTER TABLE
postgres@han_db=> \d tbl_unique_index
Table "public.tbl_unique_index"
Column | Type | Collation | Nullable | Default
--------+---------+-----------+----------+---------
a | integer | | not null |
b | integer | | |
Indexes:
"pk_tbl_unique_index_a" PRIMARY KEY, btree (a)
"idx_unq_tbl_unique_index_a_b" UNIQUE, btree (a, b)
"uk_tbl_unique_index_b" UNIQUE CONSTRAINT, btree (b)
-- 插入实例
postgres@han_db=>insert into tbl_unique_index values (1);
INSERT 0 1
postgres@han_db=>insert into tbl_unique_index values (1);
ERROR: duplicate key value violates unique constraint "pk_tbl_unique_index_a"
DETAIL: Key (a)=(1) already exists.
postgres@han_db=>insert into tbl_unique_index values (1);
ERROR: duplicate key value violates unique constraint "pk_tbl_unique_index_a"
DETAIL: Key (a)=(1) already exists.表达式索引
除针对表的字段直接创建索引外,还可以对字段进行某种运算之后的结果创建索引
--测试表
postgres@han_db=>create table tbl_expression(a varchar(32), b varchar(32));
CREATE TABLE

postgres@han_db=>insert into tbl_expression select concat('test',x),concat('you',x) from generate_series(1,10000) x;
INSERT 0 10000

-- 如果此时分别在a和b字段上各创建一个Btree索引,分别使用a和b字段查询时会进行索引扫描
postgres@han_db=>create index idx_tbl_expression_a on tbl_expression using btree (a);
CREATE INDEX

postgres@han_db=>create index idx_tbl_expression_b on tbl_expression using btree (b);
CREATE INDEX

postgres@han_db=>explain analyze select * from tbl_expression where a = 'TEST';
                                                              QUERY PLAN

-------------------------------------------------------------------------------------------------------------------------------
-------
 Index Scan using idx_tbl_expression_a on tbl_expression  (cost=0.29..8.30 rows=1 width=15) (actual time=0.020..0.020 rows=0 lo
ops=1)
   Index Cond: ((a)::text = 'TEST'::text)
 Planning Time: 0.297 ms
 Execution Time: 0.041 ms
(4 rows)

                                                              QUERY PLAN

-------------------------------------------------------------------------------------------------------------------------------
-------
 Index Scan using idx_tbl_expression_b on tbl_expression  (cost=0.29..8.30 rows=1 width=15) (actual time=0.047..0.047 rows=0 lo
ops=1)
   Index Cond: ((b)::text = 'you'::text)
 Planning Time: 0.043 ms
 Execution Time: 0.056 ms
(4 rows)
--测试表
postgres@han_db=>create table tbl_expression(a varchar(32), b varchar(32));
CREATE TABLE
postgres@han_db=>insert into tbl_expression select concat('test',x),concat('you',x) from generate_series(1,10000) x;
INSERT 0 10000
-- 如果此时分别在a和b字段上各创建一个Btree索引,分别使用a和b字段查询时会进行索引扫描
postgres@han_db=>create index idx_tbl_expression_a on tbl_expression using btree (a);
CREATE INDEX
postgres@han_db=>create index idx_tbl_expression_b on tbl_expression using btree (b);
CREATE INDEX
postgres@han_db=>explain analyze select * from tbl_expression where a = 'TEST';
QUERY PLAN
-------------------------------------------------------------------------------------------------------------------------------
-------
Index Scan using idx_tbl_expression_a on tbl_expression (cost=0.29..8.30 rows=1 width=15) (actual time=0.020..0.020 rows=0 lo
ops=1)
Index Cond: ((a)::text = 'TEST'::text)
Planning Time: 0.297 ms
Execution Time: 0.041 ms
(4 rows)
QUERY PLAN
-------------------------------------------------------------------------------------------------------------------------------
-------
Index Scan using idx_tbl_expression_b on tbl_expression (cost=0.29..8.30 rows=1 width=15) (actual time=0.047..0.047 rows=0 lo
ops=1)
Index Cond: ((b)::text = 'you'::text)
Planning Time: 0.043 ms
Execution Time: 0.056 ms
(4 rows)但是下面的两种查询方式是不会进行索引扫描的
postgres@han_db=>select * from tbl_expression where upper(a) = 'TEST';
 a | b
---+---
(0 rows)

postgres@han_db=>select * from tbl_expression where (a || ' ' ||b) = 'test you';
 a | b
---+---
(0 rows)

postgres@han_db=>explain analyze select * from tbl_expression where upper(a) = 'TEST';
                                                 QUERY PLAN
------------------------------------------------------------------------------------------------------------
 Seq Scan on tbl_expression  (cost=0.00..213.00 rows=50 width=15) (actual time=2.447..2.447 rows=0 loops=1)
   Filter: (upper((a)::text) = 'TEST'::text)
   Rows Removed by Filter: 10000
 Planning Time: 0.034 ms
 Execution Time: 2.456 ms
(5 rows)

postgres@han_db=>explain analyze select * from tbl_expression where (a || ' ' ||b) = 'test you';
                                                 QUERY PLAN
------------------------------------------------------------------------------------------------------------
 Seq Scan on tbl_expression  (cost=0.00..238.00 rows=50 width=15) (actual time=1.370..1.370 rows=0 loops=1)
   Filter: ((((a)::text || ' '::text) || (b)::text) = 'test you'::text)
   Rows Removed by Filter: 10000
 Planning Time: 0.039 ms
 Execution Time: 1.381 ms
(5 rows)

-- 此时就可以使用表达式创建索引来解决此类全表扫描问题
postgres@han_db=>explain analyze select * from tbl_expression where upper(a) = 'TEST';
                                                 QUERY PLAN
------------------------------------------------------------------------------------------------------------
 Seq Scan on tbl_expression  (cost=0.00..213.00 rows=50 width=15) (actual time=9.952..9.952 rows=0 loops=1)
   Filter: (upper((a)::text) = 'TEST'::text)
   Rows Removed by Filter: 10000
 Planning Time: 0.098 ms
 Execution Time: 9.980 ms
(5 rows)

postgres@han_db=>create index idx_tbl_expression_a_b on tbl_expression ((a||' '||b));
CREATE INDE

postgres@han_db=>explain analyze select * from tbl_expression where (a || ' ' ||b) = 'test you';
                                                           QUERY PLAN

-------------------------------------------------------------------------------------------------------------------------------
-
 Bitmap Heap Scan on tbl_expression  (cost=4.67..67.91 rows=50 width=15) (actual time=0.095..0.095 rows=0 loops=1)
   Recheck Cond: ((((a)::text || ' '::text) || (b)::text) = 'test you'::text)
   ->  Bitmap Index Scan on idx_tbl_expression_a_b  (cost=0.00..4.66 rows=50 width=0) (actual time=0.092..0.092 rows=0 loops=1)
         Index Cond: ((((a)::text || ' '::text) || (b)::text) = 'test you'::text)
 Planning Time: 0.441 ms
 Execution Time: 0.136 ms
(6 rows)


但是还是需要根据实际业务情况仔细评估后决定采用何种索引,因为并不是索引越多越好postgres@han_db=>select * from tbl_expression where upper(a) = 'TEST';
a | b
---+---
(0 rows)
postgres@han_db=>select * from tbl_expression where (a || ' ' ||b) = 'test you';
a | b
---+---
(0 rows)
postgres@han_db=>explain analyze select * from tbl_expression where upper(a) = 'TEST';
QUERY PLAN
------------------------------------------------------------------------------------------------------------
Seq Scan on tbl_expression (cost=0.00..213.00 rows=50 width=15) (actual time=2.447..2.447 rows=0 loops=1)
Filter: (upper((a)::text) = 'TEST'::text)
Rows Removed by Filter: 10000
Planning Time: 0.034 ms
Execution Time: 2.456 ms
(5 rows)
postgres@han_db=>explain analyze select * from tbl_expression where (a || ' ' ||b) = 'test you';
QUERY PLAN
------------------------------------------------------------------------------------------------------------
Seq Scan on tbl_expression (cost=0.00..238.00 rows=50 width=15) (actual time=1.370..1.370 rows=0 loops=1)
Filter: ((((a)::text || ' '::text) || (b)::text) = 'test you'::text)
Rows Removed by Filter: 10000
Planning Time: 0.039 ms
Execution Time: 1.381 ms
(5 rows)
-- 此时就可以使用表达式创建索引来解决此类全表扫描问题
postgres@han_db=>explain analyze select * from tbl_expression where upper(a) = 'TEST';
QUERY PLAN
------------------------------------------------------------------------------------------------------------
Seq Scan on tbl_expression (cost=0.00..213.00 rows=50 width=15) (actual time=9.952..9.952 rows=0 loops=1)
Filter: (upper((a)::text) = 'TEST'::text)
Rows Removed by Filter: 10000
Planning Time: 0.098 ms
Execution Time: 9.980 ms
(5 rows)
postgres@han_db=>create index idx_tbl_expression_a_b on tbl_expression ((a||' '||b));
CREATE INDE
postgres@han_db=>explain analyze select * from tbl_expression where (a || ' ' ||b) = 'test you';
QUERY PLAN
-------------------------------------------------------------------------------------------------------------------------------
-
Bitmap Heap Scan on tbl_expression (cost=4.67..67.91 rows=50 width=15) (actual time=0.095..0.095 rows=0 loops=1)
Recheck Cond: ((((a)::text || ' '::text) || (b)::text) = 'test you'::text)
-> Bitmap Index Scan on idx_tbl_expression_a_b (cost=0.00..4.66 rows=50 width=0) (actual time=0.092..0.092 rows=0 loops=1)
Index Cond: ((((a)::text || ' '::text) || (b)::text) = 'test you'::text)
Planning Time: 0.441 ms
Execution Time: 0.136 ms
(6 rows)
但是还是需要根据实际业务情况仔细评估后决定采用何种索引,因为并不是索引越多越好部分索引
只在自己感兴趣的那部分数据上创建索引,而不是对每一行数据都创建索引,此种方式创建索引就需要使用WHERE条件了

创建两个完全相同的表比较部分索引和全索引的区别
postgres@han_db=>create table tbl_partial_index(id bigint,alarm_time timestamp without time zone,level varchar(12),alarm_desc varchar(100));
CREATE TABLE

postgres@han_db=>create table tbl_partial_index1(id bigint,alarm_time timestamp without time zone,level varchar(12),alarm_desc varchar(100));
CREATE TABLE

-- 写入完全相同的数据
test=# insert into tbl_partial_index(id,alarm_time,level,alarm_desc)
select generate_series(1,9000000),clock_timestamp()::timestamp without time zone,'green','正常';
INSERT 0 9000000

test=# insert into tbl_partial_index(id,alarm_time,level,alarm_desc)
select generate_series(9000000,9000100),clock_timestamp()::timestamp without time zone,'red','攻击';
INSERT 0 101
test=#
test=#
test=# insert into tbl_partial_index1(id,alarm_time,level,alarm_desc)
select generate_series(1,9000000),clock_timestamp()::timestamp without time zone,'green','正常';
INSERT 0 9000000

test=# insert into tbl_partial_index1(id,alarm_time,level,alarm_desc)
select generate_series(9000000,9000100),clock_timestamp()::timestamp without time zone,'red','攻击';
INSERT 0 101

-- 示例1.在tbl_partial_index表字段level上创建索引
postgres@han_db=>create index idx_tbl_partial_index_level on tbl_partial_index using btree (level);
CREATE INDEX
postgres@han_db=>explain analyze select * from tbl_partial_index where level = 'red';
                                                                    QUERY PLAN

-------------------------------------------------------------------------------------------------------------------------------
-------------------
 Index Scan using idx_tbl_partial_index_level on tbl_partial_index  (cost=0.43..4.45 rows=1 width=29) (actual time=0.020..0.030
 rows=101 loops=1)
   Index Cond: ((level)::text = 'red'::text)
 Planning Time: 0.142 ms
 Execution Time: 0.045 ms
(4 rows)

-- 索引大小
postgres@han_db=>select relname,pg_size_pretty(pg_relation_size(oid)) from pg_class where relname='idx_tbl_partial_index_level';
           relname           | pg_size_pretty
-----------------------------+----------------
 idx_tbl_partial_index_level | 193 MB
(1 row)

-- 示例2.在tbl_partial_index1表字段level等于red的行上创建索引
postgres@han_db=>create index idx_tbl_partial_index1_level on tbl_partial_index1(level) where level = 'red';
CREATE INDEX
postgres@han_db=>explain analyze select * from tbl_partial_index1 where level = 'red';
                                                                     QUERY PLAN

-------------------------------------------------------------------------------------------------------------------------------
---------------------
 Index Scan using idx_tbl_partial_index1_level on tbl_partial_index1  (cost=0.14..4.16 rows=1 width=29) (actual time=0.012..0.0
31 rows=101 loops=1)
 Planning Time: 1.736 ms
 Execution Time: 0.047 ms
(3 rows)

postgres@han_db=>select relname,pg_size_pretty(pg_relation_size(oid)) from pg_class where relname='idx_tbl_partial_index1_level';
           relname            | pg_size_pretty
------------------------------+----------------
 idx_tbl_partial_index1_level | 16 kB
(1 row)

比较上面两个示例的结果可知,全表索引在耗时和大小方面要比部分索引消耗更多的资源,查询'red'的数据排除环境影响基本相同,数据量更大,'red'占比更小时性能可能会有明显差异,但是查询非'red'数据时全表索引会有明显的性能优势,因为部分索引并没有'green'数据的索引,走的是全表扫描。

综上,根据数据的使用方式创建不同的索引在性能上是有明显差异的postgres@han_db=>create table tbl_partial_index(id bigint,alarm_time timestamp without time zone,level varchar(12),alarm_desc varchar(100));
CREATE TABLE
postgres@han_db=>create table tbl_partial_index1(id bigint,alarm_time timestamp without time zone,level varchar(12),alarm_desc varchar(100));
CREATE TABLE
-- 写入完全相同的数据
test=# insert into tbl_partial_index(id,alarm_time,level,alarm_desc)
select generate_series(1,9000000),clock_timestamp()::timestamp without time zone,'green','正常';
INSERT 0 9000000
test=# insert into tbl_partial_index(id,alarm_time,level,alarm_desc)
select generate_series(9000000,9000100),clock_timestamp()::timestamp without time zone,'red','攻击';
INSERT 0 101
test=#
test=#
test=# insert into tbl_partial_index1(id,alarm_time,level,alarm_desc)
select generate_series(1,9000000),clock_timestamp()::timestamp without time zone,'green','正常';
INSERT 0 9000000
test=# insert into tbl_partial_index1(id,alarm_time,level,alarm_desc)
select generate_series(9000000,9000100),clock_timestamp()::timestamp without time zone,'red','攻击';
INSERT 0 101
-- 示例1.在tbl_partial_index表字段level上创建索引
postgres@han_db=>create index idx_tbl_partial_index_level on tbl_partial_index using btree (level);
CREATE INDEX
postgres@han_db=>explain analyze select * from tbl_partial_index where level = 'red';
QUERY PLAN
-------------------------------------------------------------------------------------------------------------------------------
-------------------
Index Scan using idx_tbl_partial_index_level on tbl_partial_index (cost=0.43..4.45 rows=1 width=29) (actual time=0.020..0.030
rows=101 loops=1)
Index Cond: ((level)::text = 'red'::text)
Planning Time: 0.142 ms
Execution Time: 0.045 ms
(4 rows)
-- 索引大小
postgres@han_db=>select relname,pg_size_pretty(pg_relation_size(oid)) from pg_class where relname='idx_tbl_partial_index_level';
relname | pg_size_pretty
-----------------------------+----------------
idx_tbl_partial_index_level | 193 MB
(1 row)
-- 示例2.在tbl_partial_index1表字段level等于red的行上创建索引
postgres@han_db=>create index idx_tbl_partial_index1_level on tbl_partial_index1(level) where level = 'red';
CREATE INDEX
postgres@han_db=>explain analyze select * from tbl_partial_index1 where level = 'red';
QUERY PLAN
-------------------------------------------------------------------------------------------------------------------------------
---------------------
Index Scan using idx_tbl_partial_index1_level on tbl_partial_index1 (cost=0.14..4.16 rows=1 width=29) (actual time=0.012..0.0
31 rows=101 loops=1)
Planning Time: 1.736 ms
Execution Time: 0.047 ms
(3 rows)
postgres@han_db=>select relname,pg_size_pretty(pg_relation_size(oid)) from pg_class where relname='idx_tbl_partial_index1_level';
relname | pg_size_pretty
------------------------------+----------------
idx_tbl_partial_index1_level | 16 kB
(1 row)
比较上面两个示例的结果可知,全表索引在耗时和大小方面要比部分索引消耗更多的资源,查询'red'的数据排除环境影响基本相同,数据量更大,'red'占比更小时性能可能会有明显差异,但是查询非'red'数据时全表索引会有明显的性能优势,因为部分索引并没有'green'数据的索引,走的是全表扫描。
综上,根据数据的使用方式创建不同的索引在性能上是有明显差异的索引失效
什么是索引失效?如果where过滤条件设置不合理,即使索引存在,且where过滤条件中包含索引列,也会导致全表扫描,索引不起作用
什么条件下会导致索引失效
1.任何计算、函数、类型转换
2.!=
3.NOT,相当于使用函数
4.模糊查询通配符在开头
5.索引字段在表中占比较高
6.多字段btree索引查询条件不包含第一列
7.多字段索引查询条件使用OR(有时也会走索引扫描,但查询效率不高)
测试表
postgres@han_db=>create table tbl_index(a bigint,b timestamp without time zone ,c varchar(12));
CREATE TABLE
Time: 14.469 ms

postgres@han_db=>insert into tbl_index select generate_series(1,10000000),clock_timestamp()::timestamp without time zone,'bit me';
INSERT 0 10000000postgres@han_db=>create table tbl_index(a bigint,b timestamp without time zone ,c varchar(12));
CREATE TABLE
Time: 14.469 ms
postgres@han_db=>insert into tbl_index select generate_series(1,10000000),clock_timestamp()::timestamp without time zone,'bit me';
INSERT 0 100000001.任何计算、函数、类型转换
postgres@han_db=>create index idx_tbl_index_a on tbl_index (a);
CREATE INDEX

postgres@han_db=>explain analyze select * from tbl_index where a = 1;
                                                         QUERY PLAN
----------------------------------------------------------------------------------------------------------------------------
 Index Scan using idx_tbl_index_a on tbl_index  (cost=0.43..8.45 rows=1 width=23) (actual time=0.105..0.107 rows=1 loops=1)
   Index Cond: (a = 1)
 Planning Time: 1.098 ms
 Execution Time: 0.140 ms
(4 rows)

Time: 5.037 ms


postgres@han_db=>explain analyze select * from tbl_index where a + 1 = 1;
                                                           QUERY PLAN

-------------------------------------------------------------------------------------------------------------------------------
-
 Gather  (cost=1000.00..132195.00 rows=50000 width=23) (actual time=318.528..319.334 rows=0 loops=1)
   Workers Planned: 2
   Workers Launched: 2
   ->  Parallel Seq Scan on tbl_index  (cost=0.00..126195.00 rows=20833 width=23) (actual time=299.300..299.301 rows=0 loops=3)
         Filter: ((a + 1) = 1)
         Rows Removed by Filter: 3333333
 Planning Time: 0.105 ms
 Execution Time: 319.365 ms
(8 rows)


postgres@han_db=>explain analyze select * from tbl_index where power(a,2) = 1;
                                                           QUERY PLAN

-------------------------------------------------------------------------------------------------------------------------------
-
 Gather  (cost=1000.00..142611.67 rows=50000 width=23) (actual time=1.433..360.417 rows=1 loops=1)
   Workers Planned: 2
   Workers Launched: 2
   ->  Parallel Seq Scan on tbl_index  (cost=0.00..136611.67 rows=20833 width=23) (actual time=226.017..343.752 rows=0 loops=3)
         Filter: (power((a)::double precision, '2'::double precision) = '1'::double precision)
         Rows Removed by Filter: 3333333
 Planning Time: 0.179 ms
 Execution Time: 360.445 ms
(8 rows)

Time: 366.390 ms


postgres@han_db=>explain analyze select * from tbl_index where a::varchar = '1';
                                                           QUERY PLAN

--------------------------------------------------------------------------------------------
 Gather  (cost=1000.00..142611.67 rows=50000 width=23) (actual time=0.655..584.484 rows=1 loops=1)
   Workers Planned: 2
   Workers Launched: 2
   ->  Parallel Seq Scan on tbl_index  (cost=0.00..136611.67 rows=20833 width=23) (actual time=371.652..564.242 rows=0 loops=3)
         Filter: (((a)::character varying)::text = '1'::text)
         Rows Removed by Filter: 3333333
 Planning Time: 1.378 ms
 Execution Time: 584.528 ms
(8 rows)

Time: 586.817 ms


在表tbl_index.a字段创建btree索引,使用a=1索引生效,但是下面的例子运算、函数、类型转换却导致索引失效了。

where a + 1 = 1

where power(a,2) = 1

where a::varchar = '1'

如何解决呢?可参考前面的表达式索引解决:

create index idx_tbl_index_a on tbl_index ((a+1));

create index idx_tbl_index_a on tbl_index ((power(a,2)));

create index idx_tbl_index_a on tbl_index ((a::varchar));postgres@han_db=>create index idx_tbl_index_a on tbl_index (a);
CREATE INDEX
postgres@han_db=>explain analyze select * from tbl_index where a = 1;
QUERY PLAN
----------------------------------------------------------------------------------------------------------------------------
Index Scan using idx_tbl_index_a on tbl_index (cost=0.43..8.45 rows=1 width=23) (actual time=0.105..0.107 rows=1 loops=1)
Index Cond: (a = 1)
Planning Time: 1.098 ms
Execution Time: 0.140 ms
(4 rows)
Time: 5.037 ms
postgres@han_db=>explain analyze select * from tbl_index where a + 1 = 1;
QUERY PLAN
-------------------------------------------------------------------------------------------------------------------------------
-
Gather (cost=1000.00..132195.00 rows=50000 width=23) (actual time=318.528..319.334 rows=0 loops=1)
Workers Planned: 2
Workers Launched: 2
-> Parallel Seq Scan on tbl_index (cost=0.00..126195.00 rows=20833 width=23) (actual time=299.300..299.301 rows=0 loops=3)
Filter: ((a + 1) = 1)
Rows Removed by Filter: 3333333
Planning Time: 0.105 ms
Execution Time: 319.365 ms
(8 rows)
postgres@han_db=>explain analyze select * from tbl_index where power(a,2) = 1;
QUERY PLAN
-------------------------------------------------------------------------------------------------------------------------------
-
Gather (cost=1000.00..142611.67 rows=50000 width=23) (actual time=1.433..360.417 rows=1 loops=1)
Workers Planned: 2
Workers Launched: 2
-> Parallel Seq Scan on tbl_index (cost=0.00..136611.67 rows=20833 width=23) (actual time=226.017..343.752 rows=0 loops=3)
Filter: (power((a)::double precision, '2'::double precision) = '1'::double precision)
Rows Removed by Filter: 3333333
Planning Time: 0.179 ms
Execution Time: 360.445 ms
(8 rows)
Time: 366.390 ms
postgres@han_db=>explain analyze select * from tbl_index where a::varchar = '1';
QUERY PLAN
--------------------------------------------------------------------------------------------
Gather (cost=1000.00..142611.67 rows=50000 width=23) (actual time=0.655..584.484 rows=1 loops=1)
Workers Planned: 2
Workers Launched: 2
-> Parallel Seq Scan on tbl_index (cost=0.00..136611.67 rows=20833 width=23) (actual time=371.652..564.242 rows=0 loops=3)
Filter: (((a)::character varying)::text = '1'::text)
Rows Removed by Filter: 3333333
Planning Time: 1.378 ms
Execution Time: 584.528 ms
(8 rows)
Time: 586.817 ms
在表tbl_index.a字段创建btree索引,使用a=1索引生效,但是下面的例子运算、函数、类型转换却导致索引失效了。
where a + 1 = 1
where power(a,2) = 1
where a::varchar = '1'
如何解决呢?可参考前面的表达式索引解决:
create index idx_tbl_index_a on tbl_index ((a+1));
create index idx_tbl_index_a on tbl_index ((power(a,2)));
create index idx_tbl_index_a on tbl_index ((a::varchar));2.!=
postgres@han_db=>explain analyze select * from tbl_index where a != 1;
                                                      QUERY PLAN
--------------------------------------------------------------------------------------------
 Seq Scan on tbl_index  (cost=0.00..188695.00 rows=9999999 width=23) (actual time=0.025..769.603 rows=9999999 loops=1)
   Filter: (a <> 1)
   Rows Removed by Filter: 1
 Planning Time: 0.120 ms
 Execution Time: 1050.284 ms
(5 rows)

Time: 1051.117 ms (00:01.051)postgres@han_db=>explain analyze select * from tbl_index where a != 1;
QUERY PLAN
--------------------------------------------------------------------------------------------
Seq Scan on tbl_index (cost=0.00..188695.00 rows=9999999 width=23) (actual time=0.025..769.603 rows=9999999 loops=1)
Filter: (a <> 1)
Rows Removed by Filter: 1
Planning Time: 0.120 ms
Execution Time: 1050.284 ms
(5 rows)
Time: 1051.117 ms (00:01.051)3.NOT,相当于使用函数
postgres@han_db=> explain analyze select * from tbl_index where a is null;
                                                         QUERY PLAN
--------------------------------------------------------------------------------------------
 Index Scan using idx_tbl_index_a on tbl_index  (cost=0.43..4.45 rows=1 width=23) (actual time=0.223..0.223 rows=0 loops=1)
   Index Cond: (a IS NULL)
 Planning Time: 0.205 ms
 Execution Time: 0.258 ms
(4 rows)

Time: 1.205 ms


postgres@han_db=> explain analyze select * from tbl_index where a is not null;
                                                       QUERY PLAN
-------------------------------------------------------------------------------------------
 Seq Scan on tbl_index  (cost=0.00..163695.00 rows=10000000 width=23) (actual time=0.029..765.278 rows=10000000 loops=1)
   Filter: (a IS NOT NULL)
 Planning Time: 0.118 ms
 Execution Time: 1051.602 ms
(4 rows)

Time: 1052.313 ms (00:01.052)


以上比较可知where a is null索引生效,但是where a is not null导致索引生效。类似导致索引失效的还有NOT IN,NOT LIKE等,但是NOT EXISTS不会导致索引失效。下面的例子可以看到tbl_index表仍进行索引扫描,但是性能仍有限制,使用NOT IN虽然索引失效,但性能比NOT EXISTS要高。这个和我之前的认识有些出入,之前测试发现NOT EXISTS比NOT IN性能高,看来情况不同,性能也是不一定postgres@han_db=> explain analyze select * from tbl_index where a is null;
QUERY PLAN
--------------------------------------------------------------------------------------------
Index Scan using idx_tbl_index_a on tbl_index (cost=0.43..4.45 rows=1 width=23) (actual time=0.223..0.223 rows=0 loops=1)
Index Cond: (a IS NULL)
Planning Time: 0.205 ms
Execution Time: 0.258 ms
(4 rows)
Time: 1.205 ms
postgres@han_db=> explain analyze select * from tbl_index where a is not null;
QUERY PLAN
-------------------------------------------------------------------------------------------
Seq Scan on tbl_index (cost=0.00..163695.00 rows=10000000 width=23) (actual time=0.029..765.278 rows=10000000 loops=1)
Filter: (a IS NOT NULL)
Planning Time: 0.118 ms
Execution Time: 1051.602 ms
(4 rows)
Time: 1052.313 ms (00:01.052)
以上比较可知where a is null索引生效,但是where a is not null导致索引生效。类似导致索引失效的还有NOT IN,NOT LIKE等,但是NOT EXISTS不会导致索引失效。下面的例子可以看到tbl_index表仍进行索引扫描,但是性能仍有限制,使用NOT IN虽然索引失效,但性能比NOT EXISTS要高。这个和我之前的认识有些出入,之前测试发现NOT EXISTS比NOT IN性能高,看来情况不同,性能也是不一定4.模糊查询通配符在开头
test=# explain analyze select * from tbl_index where c like 'bit%';
                                                        QUERY PLAN
--------------------------------------------------------------------------------------------------------------------------
 Seq Scan on tbl_index  (cost=0.00..140899.00 rows=10000000 width=23) (actual time=0.099..1685.317 rows=10000000 loops=1)
   Filter: ((c)::text ~~ 'bit%'::text)
 Planning time: 55.373 ms
 Execution time: 2104.863 ms
(4 rows)

Time: 2164.464 ms

test=# explain analyze select * from tbl_index where c like '%me';
                                                        QUERY PLAN
---------------------------------------------------------------------------------------------------------------------------
 Seq Scan on tbl_index  (cost=0.00..140899.00 rows=10000000 width=23) (actual time=20.172..5507.741 rows=10000000 loops=1)
   Filter: ((c)::text ~~ '%me'::text)
 Planning time: 65.603 ms
 Execution time: 6007.367 ms
(4 rows)test=# explain analyze select * from tbl_index where c like 'bit%';
QUERY PLAN
--------------------------------------------------------------------------------------------------------------------------
Seq Scan on tbl_index (cost=0.00..140899.00 rows=10000000 width=23) (actual time=0.099..1685.317 rows=10000000 loops=1)
Filter: ((c)::text ~~ 'bit%'::text)
Planning time: 55.373 ms
Execution time: 2104.863 ms
(4 rows)
Time: 2164.464 ms
test=# explain analyze select * from tbl_index where c like '%me';
QUERY PLAN
---------------------------------------------------------------------------------------------------------------------------
Seq Scan on tbl_index (cost=0.00..140899.00 rows=10000000 width=23) (actual time=20.172..5507.741 rows=10000000 loops=1)
Filter: ((c)::text ~~ '%me'::text)
Planning time: 65.603 ms
Execution time: 6007.367 ms
(4 rows)5.索引字段在表中占比较高
test=# insert into tbl_index values (10000001,'2015-05-23 00:00:00','haha');
INSERT 0 1
Time: 88.226 ms
test=# explain analyze select * from tbl_index where c = 'bit me';
                                                        QUERY PLAN
--------------------------------------------------------------------------------------------------------------------------
 Seq Scan on tbl_index  (cost=0.00..140899.00 rows=10000000 width=23) (actual time=0.051..6758.236 rows=10000000 loops=1)
   Filter: ((c)::text = 'bit me'::text)
   Rows Removed by Filter: 1
 Planning time: 0.128 ms
 Execution time: 7237.900 ms
(5 rows)

Time: 7238.685 ms
test=# explain analyze select * from tbl_index where c = 'haha';
                                                         QUERY PLAN
----------------------------------------------------------------------------------------------------------------------------
 Index Scan using idx_tbl_index_c on tbl_index  (cost=0.43..4.45 rows=1 width=23) (actual time=0.063..0.065 rows=1 loops=1)
   Index Cond: ((c)::text = 'haha'::text)
 Planning time: 0.219 ms
 Execution time: 2.869 ms
(4 rows)

Time: 4.942 mstest=# insert into tbl_index values (10000001,'2015-05-23 00:00:00','haha');
INSERT 0 1
Time: 88.226 ms
test=# explain analyze select * from tbl_index where c = 'bit me';
QUERY PLAN
--------------------------------------------------------------------------------------------------------------------------
Seq Scan on tbl_index (cost=0.00..140899.00 rows=10000000 width=23) (actual time=0.051..6758.236 rows=10000000 loops=1)
Filter: ((c)::text = 'bit me'::text)
Rows Removed by Filter: 1
Planning time: 0.128 ms
Execution time: 7237.900 ms
(5 rows)
Time: 7238.685 ms
test=# explain analyze select * from tbl_index where c = 'haha';
QUERY PLAN
----------------------------------------------------------------------------------------------------------------------------
Index Scan using idx_tbl_index_c on tbl_index (cost=0.43..4.45 rows=1 width=23) (actual time=0.063..0.065 rows=1 loops=1)
Index Cond: ((c)::text = 'haha'::text)
Planning time: 0.219 ms
Execution time: 2.869 ms
(4 rows)
Time: 4.942 mstest=# drop index idx_tbl_index_a;
DROP INDEX
Time: 134.873 ms
test=# drop index idx_tbl_index_c;
DROP INDEX
Time: 173.572 mstest=# drop index idx_tbl_index_a;
DROP INDEX
Time: 134.873 ms
test=# drop index idx_tbl_index_c;
DROP INDEX
Time: 173.572 ms6.多字段btree索引查询条件不包含第一列
test=# explain analyze select * from tbl_index where a = 10000001 and c = 'haha';
                                                           QUERY PLAN
--------------------------------------------------------------------------------------------------------------------------------
 Index Scan using idx_tbl_index_a_c on tbl_index  (cost=0.43..6.20 rows=1 width=23) (actual time=23.254..23.257 rows=1 loops=1)
   Index Cond: ((a = 10000001) AND ((c)::text = 'haha'::text))
 Planning time: 36.050 ms
 Execution time: 35.710 ms
(4 rows)

Time: 78.816 ms
test=# explain analyze select * from tbl_index where  c = 'haha';
                                                         QUERY PLAN
-----------------------------------------------------------------------------------------------------------------------------
 Gather  (cost=1000.00..68982.44 rows=1 width=23) (actual time=7869.579..7890.974 rows=1 loops=1)
   Workers Planned: 2
   Workers Launched: 2
   ->  Parallel Seq Scan on tbl_index  (cost=0.00..67982.34 rows=0 width=23) (actual time=7468.480..7468.480 rows=0 loops=3)
         Filter: ((c)::text = 'haha'::text)
         Rows Removed by Filter: 3333333
 Planning time: 0.130 ms
 Execution time: 7891.137 ms
(8 rows)

Time: 7891.937 ms
test=# explain analyze select * from tbl_index where a = 10000001;
                                                          QUERY PLAN
------------------------------------------------------------------------------------------------------------------------------
 Index Scan using idx_tbl_index_a_c on tbl_index  (cost=0.43..8.45 rows=1 width=23) (actual time=0.154..0.156 rows=1 loops=1)
   Index Cond: (a = 10000001)
 Planning time: 0.257 ms
 Execution time: 0.206 ms
(4 rows)

Time: 1.119 mstest=# explain analyze select * from tbl_index where a = 10000001 and c = 'haha';
QUERY PLAN
--------------------------------------------------------------------------------------------------------------------------------
Index Scan using idx_tbl_index_a_c on tbl_index (cost=0.43..6.20 rows=1 width=23) (actual time=23.254..23.257 rows=1 loops=1)
Index Cond: ((a = 10000001) AND ((c)::text = 'haha'::text))
Planning time: 36.050 ms
Execution time: 35.710 ms
(4 rows)
Time: 78.816 ms
test=# explain analyze select * from tbl_index where c = 'haha';
QUERY PLAN
-----------------------------------------------------------------------------------------------------------------------------
Gather (cost=1000.00..68982.44 rows=1 width=23) (actual time=7869.579..7890.974 rows=1 loops=1)
Workers Planned: 2
Workers Launched: 2
-> Parallel Seq Scan on tbl_index (cost=0.00..67982.34 rows=0 width=23) (actual time=7468.480..7468.480 rows=0 loops=3)
Filter: ((c)::text = 'haha'::text)
Rows Removed by Filter: 3333333
Planning time: 0.130 ms
Execution time: 7891.137 ms
(8 rows)
Time: 7891.937 ms
test=# explain analyze select * from tbl_index where a = 10000001;
QUERY PLAN
------------------------------------------------------------------------------------------------------------------------------
Index Scan using idx_tbl_index_a_c on tbl_index (cost=0.43..8.45 rows=1 width=23) (actual time=0.154..0.156 rows=1 loops=1)
Index Cond: (a = 10000001)
Planning time: 0.257 ms
Execution time: 0.206 ms
(4 rows)
Time: 1.119 ms7.多字段索引查询条件使用OR
test=# explain analyze select * from tbl_index where a = 10000001 or c = 'haha';
                                                         QUERY PLAN
-----------------------------------------------------------------------------------------------------------------------------
 Gather  (cost=1000.00..79399.11 rows=1 width=23) (actual time=7321.821..7323.593 rows=1 loops=1)
   Workers Planned: 2
   Workers Launched: 2
   ->  Parallel Seq Scan on tbl_index  (cost=0.00..78399.01 rows=0 width=23) (actual time=7307.413..7307.413 rows=0 loops=3)
         Filter: ((a = 10000001) OR ((c)::text = 'haha'::text))
         Rows Removed by Filter: 3333333
 Planning time: 0.163 ms
 Execution time: 7324.821 ms
(8 rows)

Time: 7325.532 ms
test=# explain analyze select * from tbl_index where a = 10000001 and c = 'haha';
                                                          QUERY PLAN
------------------------------------------------------------------------------------------------------------------------------
 Index Scan using idx_tbl_index_a_c on tbl_index  (cost=0.43..6.20 rows=1 width=23) (actual time=0.040..0.041 rows=1 loops=1)
   Index Cond: ((a = 10000001) AND ((c)::text = 'haha'::text))
 Planning time: 0.165 ms
 Execution time: 0.093 ms
(4 rows)

Time: 32.904 mstest=# explain analyze select * from tbl_index where a = 10000001 or c = 'haha';
QUERY PLAN
-----------------------------------------------------------------------------------------------------------------------------
Gather (cost=1000.00..79399.11 rows=1 width=23) (actual time=7321.821..7323.593 rows=1 loops=1)
Workers Planned: 2
Workers Launched: 2
-> Parallel Seq Scan on tbl_index (cost=0.00..78399.01 rows=0 width=23) (actual time=7307.413..7307.413 rows=0 loops=3)
Filter: ((a = 10000001) OR ((c)::text = 'haha'::text))
Rows Removed by Filter: 3333333
Planning time: 0.163 ms
Execution time: 7324.821 ms
(8 rows)
Time: 7325.532 ms
test=# explain analyze select * from tbl_index where a = 10000001 and c = 'haha';
QUERY PLAN
------------------------------------------------------------------------------------------------------------------------------
Index Scan using idx_tbl_index_a_c on tbl_index (cost=0.43..6.20 rows=1 width=23) (actual time=0.040..0.041 rows=1 loops=1)
Index Cond: ((a = 10000001) AND ((c)::text = 'haha'::text))
Planning time: 0.165 ms
Execution time: 0.093 ms
(4 rows)
Time: 32.904 ms2,INDEX 的命中率
1, 内存是否存在短缺的可能
SELECT
'index hit rate' AS name,
(sum(idx_blks_hit)) / nullif(sum(idx_blks_hit + idx_blks_read),0) AS ratio
FROM pg_statio_user_indexes
UNION ALL
SELECT
'table hit rate' AS name,
sum(heap_blks_hit) / nullif(sum(heap_blks_hit) + sum(heap_blks_read),0) AS ratio
FROM pg_statio_user_tables;

      name      |         ratio
----------------+------------------------
 index hit rate | 0.88235294117647058824
 table hit rate | 0.87755102040816326531
(2 rows)
SELECT
'index hit rate' AS name,
(sum(idx_blks_hit)) / nullif(sum(idx_blks_hit + idx_blks_read),0) AS ratio
FROM pg_statio_user_indexes
UNION ALL
SELECT
'table hit rate' AS name,
sum(heap_blks_hit) / nullif(sum(heap_blks_hit) + sum(heap_blks_read),0) AS ratio
FROM pg_statio_user_tables;
name | ratio
----------------+------------------------
index hit rate | 0.88235294117647058824
table hit rate | 0.87755102040816326531
(2 rows)2,查询的方式是否合理
-- 表中的INDEX 的命中率

SELECT relname,
CASE idx_scan
WHEN 0 THEN NULL
ELSE round(100.0 * idx_scan / (seq_scan + idx_scan), 5)
END percent_of_times_index_used,
n_live_tup rows_in_table
FROM
pg_stat_user_tables
ORDER BY
n_live_tup DESC;

 relname | percent_of_times_index_used | rows_in_table
---------+-----------------------------+---------------
 emp1    |                             |             7
 job     |                    14.81481 |             0
 t       |                             |             0
(3 rows)
-- 表中的INDEX 的命中率
SELECT relname,
CASE idx_scan
WHEN 0 THEN NULL
ELSE round(100.0 * idx_scan / (seq_scan + idx_scan), 5)
END percent_of_times_index_used,
n_live_tup rows_in_table
FROM
pg_stat_user_tables
ORDER BY
n_live_tup DESC;
relname | percent_of_times_index_used | rows_in_table
---------+-----------------------------+---------------
emp1 | | 7
job | 14.81481 | 0
t | | 0
(3 rows)在查询中基本上都愿意使用INDEX 来进行相关的查询,那表中的查询使用INDEX 索引和不使用之间的时间比是多少,通过这样的脚本可以进一步分析哪些表可能存在缺少搜索的情况
3 检查数据库中那些索引没有被使用过,这是一个经常需要问的问题,当然通过脚本获取的数据后,到底这个索引需要不需要,也是要在分析的,不能由于这个索引被使用的次数过小,就直接将他删除
SELECT
schemaname || '.' || relname AS table,
indexrelname AS index,
pg_size_pretty(pg_relation_size(i.indexrelid)) AS index_size,
idx_scan as index_scans
FROM pg_stat_user_indexes ui
JOIN pg_index i ON ui.indexrelid = i.indexrelid
WHERE NOT indisunique
AND idx_scan < 50
AND pg_relation_size(relid) > 5 * 8192
ORDER BY pg_relation_size(i.indexrelid) / nullif(idx_scan, 0) DESC NULLS FIRST,
pg_relation_size(i.indexrelid) DESC;
SELECT
schemaname || '.' || relname AS table,
indexrelname AS index,
pg_size_pretty(pg_relation_size(i.indexrelid)) AS index_size,
idx_scan as index_scans
FROM pg_stat_user_indexes ui
JOIN pg_index i ON ui.indexrelid = i.indexrelid
WHERE NOT indisunique
AND idx_scan < 50
AND pg_relation_size(relid) > 5 * 8192
ORDER BY pg_relation_size(i.indexrelid) / nullif(idx_scan, 0) DESC NULLS FIRST,
pg_relation_size(i.indexrelid) DESC;4,查看表大小
SELECT c.relname AS name,
pg_size_pretty(pg_total_relation_size(c.oid)) AS size
FROM pg_class c
LEFT JOIN pg_namespace n ON (n.oid = c.relnamespace)
WHERE n.nspname NOT IN ('pg_catalog', 'information_schema')
AND n.nspname !~ '^pg_toast'
AND c.relkind='r'
ORDER BY pg_total_relation_size(c.oid) DESC;

 name |    size
------+------------
 job  | 32 kB
 t    | 8192 bytes
 emp1 | 8192 bytes
(3 rows)

--或者
postgres@postgres=>\d+
                      List of relations
 Schema | Name | Type  |  Owner   |    Size    | Description
--------+------+-------+----------+------------+-------------
 public | emp1 | table | postgres | 8192 bytes |
 public | t    | table | postgres | 8192 bytes |
(2 rows)
SELECT c.relname AS name,
pg_size_pretty(pg_total_relation_size(c.oid)) AS size
FROM pg_class c
LEFT JOIN pg_namespace n ON (n.oid = c.relnamespace)
WHERE n.nspname NOT IN ('pg_catalog', 'information_schema')
AND n.nspname !~ '^pg_toast'
AND c.relkind='r'
ORDER BY pg_total_relation_size(c.oid) DESC;
name | size
------+------------
job | 32 kB
t | 8192 bytes
emp1 | 8192 bytes
(3 rows)
--或者
postgres@postgres=>\d+
List of relations
Schema | Name | Type | Owner | Size | Description
--------+------+-------+----------+------------+-------------
public | emp1 | table | postgres | 8192 bytes |
public | t | table | postgres | 8192 bytes |
(2 rows)5, 查询当前系统中语句的状态,包含锁的状态,这个语句可能是会经常被使用的,如果当前系统例如出现性能,或应用系统的问题,首先就要查看当前语句运行的情况
postgres@postgres=>SELECT count(pg_stat_activity.pid) AS number_of_queries,       substring(trim(LEADING                      FROM regexp_replace(pg_stat_activity.query, '[\n\r]+'::text,                       ' '::text, 'g'::text))                 FROM 0                 FOR 200) AS query_name,       max(age(CURRENT_TIMESTAMP, query_start)) AS max_wait_time,       wait_event,       usename,       locktype,       mode,       granted  FROM pg_stat_activity  LEFT JOIN pg_locks ON pg_stat_activity.pid = pg_locks.pid  WHERE query != '<IDLE>'    AND query NOT ILIKE '%pg_%' AND query NOT ILIKE '%application_name%' AND query NOT ILIKE '%inet%'    AND age(CURRENT_TIMESTAMP, query_start) > '5 milliseconds'::interval  GROUP BY query_name,           wait_event,           usename,           locktype,           mode,           granted  ORDER BY max_wait_time DESC;

 number_of_queries | query_name | max_wait_time | wait_event | usename | locktype | mode | granted
-------------------+------------+---------------+------------+---------+----------+------+---------
(0 rows)
postgres@postgres=>postgres@postgres=>SELECT count(pg_stat_activity.pid) AS number_of_queries, substring(trim(LEADING FROM regexp_replace(pg_stat_activity.query, '[\n\r]+'::text, ' '::text, 'g'::text)) FROM 0 FOR 200) AS query_name, max(age(CURRENT_TIMESTAMP, query_start)) AS max_wait_time, wait_event, usename, locktype, mode, granted FROM pg_stat_activity LEFT JOIN pg_locks ON pg_stat_activity.pid = pg_locks.pid WHERE query != '<IDLE>' AND query NOT ILIKE '%pg_%' AND query NOT ILIKE '%application_name%' AND query NOT ILIKE '%inet%' AND age(CURRENT_TIMESTAMP, query_start) > '5 milliseconds'::interval GROUP BY query_name, wait_event, usename, locktype, mode, granted ORDER BY max_wait_time DESC;
number_of_queries | query_name | max_wait_time | wait_event | usename | locktype | mode | granted
-------------------+------------+---------------+------------+---------+----------+------+---------
(0 rows)
postgres@postgres=>6 ,在查询中表读取在内存中的命中的数据块是一个需要被关注的参数,下面的脚本中可以看到每个表被读取时,在磁盘中读取和在内存中直接读取之间的数字和比率
postgres@postgres=>SELECT relname AS "relation",heap_blks_read AS heap_read,heap_blks_hit AS heap_hit, ( (heap_blks_hit*100) / NULLIF((heap_blks_hit + heap_blks_read), 0)) AS ratio FROM pg_statio_user_tables;
 relation | heap_read | heap_hit | ratio
----------+-----------+----------+-------
 emp1     |         1 |       19 |    95
 job      |         5 |       24 |    82
 t        |         0 |        0 |
(3 rows)postgres@postgres=>SELECT relname AS "relation",heap_blks_read AS heap_read,heap_blks_hit AS heap_hit, ( (heap_blks_hit*100) / NULLIF((heap_blks_hit + heap_blks_read), 0)) AS ratio FROM pg_statio_user_tables;
relation | heap_read | heap_hit | ratio
----------+-----------+----------+-------
emp1 | 1 | 19 | 95
job | 5 | 24 | 82
t | 0 | 0 |
(3 rows)7, 表膨胀的问题是PG中需要关注和注意的,所以经常监控膨胀率是一个很重要的问题
WITH constants AS (
SELECT current_setting('block_size')::numeric AS bs, 23 AS hdr, 4 AS ma
), bloat_info AS (
SELECT
ma,bs,schemaname,tablename,
(datawidth+(hdr+ma-(case when hdr%ma=0 THEN ma ELSE hdr%ma END)))::numeric AS datahdr,
(maxfracsum*(nullhdr+ma-(case when nullhdr%ma=0 THEN ma ELSE nullhdr%ma END))) AS nullhdr2
FROM (
SELECT
schemaname, tablename, hdr, ma, bs,
SUM((1-null_frac)*avg_width) AS datawidth,
MAX(null_frac) AS maxfracsum,
hdr+(
SELECT 1+count(*)/8
FROM pg_stats s2
WHERE null_frac<>0 AND s2.schemaname = s.schemaname AND s2.tablename = s.tablename
) AS nullhdr
FROM pg_stats s, constants
GROUP BY 1,2,3,4,5
) AS foo
), table_bloat AS (
SELECT
schemaname, tablename, cc.relpages, bs,
CEIL((cc.reltuples*((datahdr+ma-
(CASE WHEN datahdr%ma=0 THEN ma ELSE datahdr%ma END))+nullhdr2+4))/(bs-20::float)) AS otta
FROM bloat_info
JOIN pg_class cc ON cc.relname = bloat_info.tablename
JOIN pg_namespace nn ON cc.relnamespace = nn.oid AND nn.nspname = bloat_info.schemaname AND nn.nspname <> 'information_schema'
), index_bloat AS (
SELECT
schemaname, tablename, bs,
COALESCE(c2.relname,'?') AS iname, COALESCE(c2.reltuples,0) AS ituples, COALESCE(c2.relpages,0) AS ipages,
COALESCE(CEIL((c2.reltuples*(datahdr-12))/(bs-20::float)),0) AS iotta -- very rough approximation, assumes all cols
FROM bloat_info
JOIN pg_class cc ON cc.relname = bloat_info.tablename
JOIN pg_namespace nn ON cc.relnamespace = nn.oid AND nn.nspname = bloat_info.schemaname AND nn.nspname <> 'information_schema'
JOIN pg_index i ON indrelid = cc.oid
JOIN pg_class c2 ON c2.oid = i.indexrelid
)
SELECT
type, schemaname, object_name, bloat, pg_size_pretty(raw_waste) as waste
FROM
(SELECT
'table' as type,
schemaname,
tablename as object_name,
ROUND(CASE WHEN otta=0 THEN 0.0 ELSE table_bloat.relpages/otta::numeric END,1) AS bloat,
CASE WHEN relpages < otta THEN '0' ELSE (bs*(table_bloat.relpages-otta)::bigint)::bigint END AS raw_waste
FROM
table_bloat
UNION
SELECT
'index' as type,
schemaname,
tablename || '::' || iname as object_name,
ROUND(CASE WHEN iotta=0 OR ipages=0 THEN 0.0 ELSE ipages/iotta::numeric END,1) AS bloat,
CASE WHEN ipages < iotta THEN '0' ELSE (bs*(ipages-iotta))::bigint END AS raw_waste
FROM
index_bloat) bloat_summary
ORDER BY raw_waste DESC, bloat DESC;

 type  | schemaname |                         object_name                          | bloat |   waste
-------+------------+--------------------------------------------------------------+-------+------------
 table | public     | tbl_partial_index1                                           |   1.0 | 776 kB
 table | public     | tbl_partial_index                                            |   1.0 | 776 kB
 table | public     | tbl_index                                                    |   1.0 | 504 kB
 index | public     | tbl_expression::idx_tbl_expression_a_b                       |   1.5 | 136 kB
 table | public     | tbl_expression                                               |   1.2 | 72 kB
 index | pg_catalog | pg_depend::pg_depend_reference_index                         |   1.2 | 72 kB
 index | public     | tbl_expression::idx_tbl_expression_a                         |   1.2 | 48 kB
 table | pg_catalog | pg_depend                                                    |   1.1 | 40 kB
 index | pg_catalog | pg_ts_config_map::pg_ts_config_map_index                     |   2.0 | 16 kB
 index | pg_catalog | pg_amproc::pg_amproc_fam_proc_index                          |   1.7 | 16 kB
 index | pg_catalog | pg_amop::pg_amop_opr_fam_index                               |   1.4 | 16 kB
 table | pg_catalog | pg_class                                                     |   1.2 | 16 kB
 index | pg_catalog | pg_constraint::pg_constraint_conparentid_index               |   2.0 | 8192 bytes
 index | pg_catalog | pg_constraint::pg_constraint_conrelid_contypid_conname_index |   2.0 | 8192 bytes
......
WITH constants AS (
SELECT current_setting('block_size')::numeric AS bs, 23 AS hdr, 4 AS ma
), bloat_info AS (
SELECT
ma,bs,schemaname,tablename,
(datawidth+(hdr+ma-(case when hdr%ma=0 THEN ma ELSE hdr%ma END)))::numeric AS datahdr,
(maxfracsum*(nullhdr+ma-(case when nullhdr%ma=0 THEN ma ELSE nullhdr%ma END))) AS nullhdr2
FROM (
SELECT
schemaname, tablename, hdr, ma, bs,
SUM((1-null_frac)*avg_width) AS datawidth,
MAX(null_frac) AS maxfracsum,
hdr+(
SELECT 1+count(*)/8
FROM pg_stats s2
WHERE null_frac<>0 AND s2.schemaname = s.schemaname AND s2.tablename = s.tablename
) AS nullhdr
FROM pg_stats s, constants
GROUP BY 1,2,3,4,5
) AS foo
), table_bloat AS (
SELECT
schemaname, tablename, cc.relpages, bs,
CEIL((cc.reltuples*((datahdr+ma-
(CASE WHEN datahdr%ma=0 THEN ma ELSE datahdr%ma END))+nullhdr2+4))/(bs-20::float)) AS otta
FROM bloat_info
JOIN pg_class cc ON cc.relname = bloat_info.tablename
JOIN pg_namespace nn ON cc.relnamespace = nn.oid AND nn.nspname = bloat_info.schemaname AND nn.nspname <> 'information_schema'
), index_bloat AS (
SELECT
schemaname, tablename, bs,
COALESCE(c2.relname,'?') AS iname, COALESCE(c2.reltuples,0) AS ituples, COALESCE(c2.relpages,0) AS ipages,
COALESCE(CEIL((c2.reltuples*(datahdr-12))/(bs-20::float)),0) AS iotta -- very rough approximation, assumes all cols
FROM bloat_info
JOIN pg_class cc ON cc.relname = bloat_info.tablename
JOIN pg_namespace nn ON cc.relnamespace = nn.oid AND nn.nspname = bloat_info.schemaname AND nn.nspname <> 'information_schema'
JOIN pg_index i ON indrelid = cc.oid
JOIN pg_class c2 ON c2.oid = i.indexrelid
)
SELECT
type, schemaname, object_name, bloat, pg_size_pretty(raw_waste) as waste
FROM
(SELECT
'table' as type,
schemaname,
tablename as object_name,
ROUND(CASE WHEN otta=0 THEN 0.0 ELSE table_bloat.relpages/otta::numeric END,1) AS bloat,
CASE WHEN relpages < otta THEN '0' ELSE (bs*(table_bloat.relpages-otta)::bigint)::bigint END AS raw_waste
FROM
table_bloat
UNION
SELECT
'index' as type,
schemaname,
tablename || '::' || iname as object_name,
ROUND(CASE WHEN iotta=0 OR ipages=0 THEN 0.0 ELSE ipages/iotta::numeric END,1) AS bloat,
CASE WHEN ipages < iotta THEN '0' ELSE (bs*(ipages-iotta))::bigint END AS raw_waste
FROM
index_bloat) bloat_summary
ORDER BY raw_waste DESC, bloat DESC;
type | schemaname | object_name | bloat | waste
-------+------------+--------------------------------------------------------------+-------+------------
table | public | tbl_partial_index1 | 1.0 | 776 kB
table | public | tbl_partial_index | 1.0 | 776 kB
table | public | tbl_index | 1.0 | 504 kB
index | public | tbl_expression::idx_tbl_expression_a_b | 1.5 | 136 kB
table | public | tbl_expression | 1.2 | 72 kB
index | pg_catalog | pg_depend::pg_depend_reference_index | 1.2 | 72 kB
index | public | tbl_expression::idx_tbl_expression_a | 1.2 | 48 kB
table | pg_catalog | pg_depend | 1.1 | 40 kB
index | pg_catalog | pg_ts_config_map::pg_ts_config_map_index | 2.0 | 16 kB
index | pg_catalog | pg_amproc::pg_amproc_fam_proc_index | 1.7 | 16 kB
index | pg_catalog | pg_amop::pg_amop_opr_fam_index | 1.4 | 16 kB
table | pg_catalog | pg_class | 1.2 | 16 kB
index | pg_catalog | pg_constraint::pg_constraint_conparentid_index | 2.0 | 8192 bytes
index | pg_catalog | pg_constraint::pg_constraint_conrelid_contypid_conname_index | 2.0 | 8192 bytes
......8 ,在PG 中一个数据块系统中有没有进行autovacuum 什么时候做的,最后一次分析是什么时间,等等都是重要的信息,一个系统的管理或者DBA是需要知晓这些事情,并根据这些信息来进行后续的操作等等
WITH table_opts AS (
SELECT
pg_class.oid, relname, nspname, array_to_string(reloptions, '') AS relopts
FROM
pg_class INNER JOIN pg_namespace ns ON relnamespace = ns.oid
), vacuum_settings AS (
SELECT
oid, relname, nspname,
CASE
WHEN relopts LIKE '%autovacuum_analyze_threshold%'
THEN substring(relopts, '.*autovacuum_analyze_threshold=([0-9.]+).*')::integer
ELSE current_setting('autovacuum_analyze_threshold')::integer
END AS autovacuum_analyze_threshold,
CASE
WHEN relopts LIKE '%autovacuum_analyze_scale_factor%'
THEN substring(relopts, '.*autovacuum_analyze_scale_factor=([0-9.]+).*')::real
ELSE current_setting('autovacuum_analyze_scale_factor')::real
END AS autovacuum_analyze_scale_factor
FROM
table_opts
)
SELECT
vacuum_settings.relname AS table,
to_char(psut.last_analyze, 'YYYY-MM-DD HH24:MI') AS last_analyze,
to_char(psut.last_autoanalyze, 'YYYY-MM-DD HH24:MI') AS last_autoanalyze,
to_char(pg_class.reltuples, '9G999G999G999') AS rowcount,
to_char(pg_class.reltuples / NULLIF(pg_class.relpages, 0), '999G999.99') AS rows_per_page,
to_char(autovacuum_analyze_threshold
+ (autovacuum_analyze_scale_factor::numeric * pg_class.reltuples), '9G999G999G999') AS autovacuum_analyze_threshold,
CASE
WHEN autovacuum_analyze_threshold + (autovacuum_analyze_scale_factor::numeric * pg_class.reltuples) < psut.n_dead_tup
THEN 'yes'
END AS will_analyze
FROM
pg_stat_user_tables psut INNER JOIN pg_class ON psut.relid = pg_class.oid
INNER JOIN vacuum_settings ON pg_class.oid = vacuum_settings.oid
ORDER BY 1;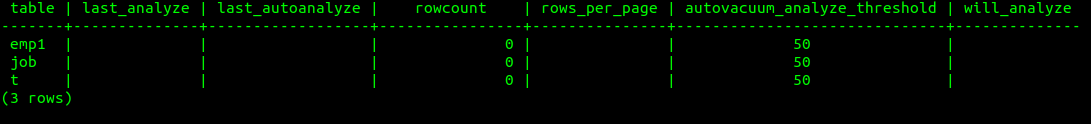
5,将VIEW 和表之间的关系打印出来
postgres@postgres=>SELECT view_schema,view_name parent, table_schema, table_name FROM information_schema.view_table_usage WHERE view_name LIKE '_' order by view_name;

 view_schema | parent | table_schema | table_name
-------------+--------+--------------+------------
(0 rows)postgres@postgres=>SELECT view_schema,view_name parent, table_schema, table_name FROM information_schema.view_table_usage WHERE view_name LIKE '_' order by view_name;
view_schema | parent | table_schema | table_name
-------------+--------+--------------+------------
(0 rows)6,查看锁表
postgres@postgres=>SELECT lock1.pid as locked_pid,stat1.usename as locked_user,stat1.query as locked_statement,stat1.state as state,stat2.query as locking_statement,stat2.state as state,now() - stat1.query_start as locking_duration,lock2.pid as locking_pid,stat2.usename as locking_user FROM pg_catalog.pg_locks lock1 JOIN pg_catalog.pg_stat_activity stat1 on lock1.pid = stat1.pid JOIN pg_catalog.pg_locks lock2 on(lock1.locktype,lock1.database,lock1.relation,lock1.page,lock1.tuple,lock1.virtualxid,lock1.transactionid,lock1.classid,lock1.objid,lock1.objsubid) IS NOT DISTINCT FROM (lock2.locktype,lock2.DATABASE,lock2.relation,lock2.page,lock2.tuple,lock2.virtualxid,lock2.transactionid,lock2.classid,lock2.objid,lock2.objsubid) JOIN pg_catalog.pg_stat_activity stat2 on lock2.pid= stat2.pid WHERE NOT lock1.granted AND lock2.granted;postgres@postgres=>SELECT lock1.pid as locked_pid,stat1.usename as locked_user,stat1.query as locked_statement,stat1.state as state,stat2.query as locking_statement,stat2.state as state,now() - stat1.query_start as locking_duration,lock2.pid as locking_pid,stat2.usename as locking_user FROM pg_catalog.pg_locks lock1 JOIN pg_catalog.pg_stat_activity stat1 on lock1.pid = stat1.pid JOIN pg_catalog.pg_locks lock2 on(lock1.locktype,lock1.database,lock1.relation,lock1.page,lock1.tuple,lock1.virtualxid,lock1.transactionid,lock1.classid,lock1.objid,lock1.objsubid) IS NOT DISTINCT FROM (lock2.locktype,lock2.DATABASE,lock2.relation,lock2.page,lock2.tuple,lock2.virtualxid,lock2.transactionid,lock2.classid,lock2.objid,lock2.objsubid) JOIN pg_catalog.pg_stat_activity stat2 on lock2.pid= stat2.pid WHERE NOT lock1.granted AND lock2.granted;将连接切断.
select pg_terminate_backend(pid)
6,重复索引
对于找到无用的index的问题,有两个点可以被用到, 第一个技术是找到索引重复的, 第二个是基于索引被访问到的状态.
WITH index_info AS

(SELECT pg_get_indexdef(indexrelid) AS index_def, indexrelid::regclass

index_name , indrelid::regclass table_name, array_agg(attname) AS index_att

FROM  pg_index i

JOIN pg_attribute a ON i.indexrelid = a.attrelid

GROUP BY pg_get_indexdef(indexrelid), indrelid, indexrelid

)

SELECT DISTINCT

CASE WHEN a.index_name > b.index_name THEN a.index_def

ELSE b.index_def END AS index_def,

CASE WHEN a.index_name > b.index_name THEN

a.index_name ELSE b.index_name END AS index_name,

CASE WHEN a.index_name > b.index_name THEN b.index_def

ELSE a.index_def END AS overlap_index_def,

CASE WHEN a.index_name > b.index_name THEN b.index_def

ELSE a.index_def END AS overlap_index_name,

a.table_name

FROM

index_info a INNER

JOIN index_info b ON a.index_name != b.index_name

AND a.table_name = b.table_name AND a.index_att && b.index_att ;
WITH index_info AS
(SELECT pg_get_indexdef(indexrelid) AS index_def, indexrelid::regclass
index_name , indrelid::regclass table_name, array_agg(attname) AS index_att
FROM pg_index i
JOIN pg_attribute a ON i.indexrelid = a.attrelid
GROUP BY pg_get_indexdef(indexrelid), indrelid, indexrelid
)
SELECT DISTINCT
CASE WHEN a.index_name > b.index_name THEN a.index_def
ELSE b.index_def END AS index_def,
CASE WHEN a.index_name > b.index_name THEN
a.index_name ELSE b.index_name END AS index_name,
CASE WHEN a.index_name > b.index_name THEN b.index_def
ELSE a.index_def END AS overlap_index_def,
CASE WHEN a.index_name > b.index_name THEN b.index_def
ELSE a.index_def END AS overlap_index_name,
a.table_name
FROM
index_info a INNER
JOIN index_info b ON a.index_name != b.index_name
AND a.table_name = b.table_name AND a.index_att && b.index_att ;面这段寻找INDEX 重复的主要是基于INDEX NAME 和创建INDEX语句的比对生成的. 所以在给出结果后,还需要人工来进行更细致的比对,不能进行直接的重复索引的清理
2,DBA最常用SQL
postgres@postgres=>create schema dba;
CREATE SCHEMA

postgres@postgres=>create view dba.invalid_index as select indisvalid, indexrelid::regclass, indrelid::regclass, pg_get_indexdef(indexrelid) from pg_index where not indisvalid;
CREATE VIEW

postgres@postgres=>create view dba.ro_conflicts as select datname,pg_stat_get_db_conflict_all(oid) conflict_all,pg_stat_get_db_conflict_bufferpin(oid) conflict_bufferpin,pg_stat_get_db_conflict_lock(oid) conflict_lock,pg_stat_get_db_conflict_snapshot(oid) conflict_snapshot,pg_stat_get_db_conflict_startup_deadlock(oid) conflict_deadlock,pg_stat_get_db_conflict_tablespace(oid) conflict_tbs from pg_database;postgres@postgres=>create schema dba;
CREATE SCHEMA
postgres@postgres=>create view dba.invalid_index as select indisvalid, indexrelid::regclass, indrelid::regclass, pg_get_indexdef(indexrelid) from pg_index where not indisvalid;
CREATE VIEW
postgres@postgres=>create view dba.ro_conflicts as select datname,pg_stat_get_db_conflict_all(oid) conflict_all,pg_stat_get_db_conflict_bufferpin(oid) conflict_bufferpin,pg_stat_get_db_conflict_lock(oid) conflict_lock,pg_stat_get_db_conflict_snapshot(oid) conflict_snapshot,pg_stat_get_db_conflict_startup_deadlock(oid) conflict_deadlock,pg_stat_get_db_conflict_tablespace(oid) conflict_tbs from pg_database;create or replace procedure dba.tps() as $$
declare
v1 int8;
v2 int8;
begin
select txid_snapshot_xmax(txid_current_snapshot()) into v1;
commit;
perform pg_sleep(1);
select txid_snapshot_xmax(txid_current_snapshot()) into v2;
commit;
raise notice 'tps: %', v2-v1;
end;
$$ language plpgsql ;create or replace procedure dba.tps() as $$
declare
v1 int8;
v2 int8;
begin
select txid_snapshot_xmax(txid_current_snapshot()) into v1;
commit;
perform pg_sleep(1);
select txid_snapshot_xmax(txid_current_snapshot()) into v2;
commit;
raise notice 'tps: %', v2-v1;
end;
$$ language plpgsql ;https://blog.csdn.net/horses/article/details/115058511?spm=1001.2014.3001.5501